Read Taiwan through its numbers, and find where every number comes from
This page connects Taiwan's numbers to the stories on this site. Start with seventy-five years of long lines showing how Taiwan became what it is, then read seven questions, each explaining why its numbers matter. After that you can look up any number's value, period and official source, and get the raw data. Every figure comes from Taiwan's own official statistics, under Taiwan's own name, and the whole table can be downloaded.
Figures verified on October 22, 2026. Tap a number for its source, a ten-year comparison and related articles.
From 1950 to today
Seventy-five years: how Taiwan became what it is today
At the end of 1950 Taiwan had 7.55 million people, and 320,000 babies were born that year. GDP per person in 1951 came to US$154 (nominal, at that year's rate of NT$10.3 to the dollar), and in 1960 farming still made up 28% of national output. Martial law took effect on 20 May 1949 and lasted thirty-eight years.
Over the next seventy-five years, the population grew to a peak of 23.6 million at the end of 2019 and then began to fall. Births peaked in 1963 at 427,000; in 2025 there were 108,000. GDP per person reached US$39,515 in 2025; farming's share of output fell to 1.44%, while industry's share has climbed back since 2000, to 43.45% in 2025, its highest since 1987.
The order in which these changes happened explains a great deal about Taiwan today: the economic take-off began under martial law, with the Kaohsiung Export Processing Zone opening in 1966 and Hsinchu Science Park in 1980. Democratisation followed a mature economy: martial law was lifted in 1987, the year TSMC was founded; the first direct presidential election came in 1996 and the first change of ruling party in 2000.
So Taiwan today is several things at once. About 90% of the world's most advanced chips, at 5 nanometres and below, are made by TSMC; one person in five is 65 or older; and martial law ended less than forty years ago. The three pull on one another: the growth chips bring has to support an ageing society, and how that growth is shared is decided by a young democracy.
Each of the seven chapters below starts from one number: how it came to be what it is, what it sets in motion across society, and which stories on the site tell more.
Births peaked in 1963; the population did not peak until 2019
Martial law (1949–1987) After martial law
Populationpeople, year-end
7.6M 1950 23.6M 2019 23.3M 2025
Birthsper year
323.6K 1950 427.2K 1963 107.8K 2025
Aged 65+% of population
2.5% 1950 20.1% 2025
GDP per personUS$, nominal
154 1951 39,515 2025
Farming's share of output% of GDP
28.2% 1960 1.4% 2025
1950 1960 1970 1980 1990 2000 2010 2020
1966 Kaohsiung Export Processing Zone opens
1980 Hsinchu Science Park opens
1987 Martial law lifted; TSMC founded
1995 National Health Insurance begins
1996 First direct presidential election
2000 First change of ruling party
2019 Population peaks (23.6 million at year-end)
Births peaked in 1963; the population did not peak until 2019
Year
Population(people, year-end)
Births(per year)
Aged 65+(% of population)
GDP per person(US$, nominal)
Farming's share of output(% of GDP)
1950
7.6M
323.6K
2.5%
—
—
1951
—
—
—
154
—
1955
9.1M
403.7K
2.5%
216
—
1960
10.8M
419.4K
2.5%
163
28.2%
1963
—
427.2K
—
—
—
1965
12.6M
406.6K
2.7%
229
23.4%
1970
14.7M
394K
2.9%
397
15.3%
1975
16.2M
369.3K
3.5%
985
12.5%
1980
17.9M
413.9K
4.3%
2,389
7.5%
1985
19.3M
346.2K
5.1%
3,314
5.7%
1990
20.4M
335.6K
6.2%
8,205
4.0%
1995
21.4M
329.6K
7.6%
13,119
3.3%
2000
22.3M
305.3K
8.6%
14,908
2.0%
2005
22.8M
205.9K
9.7%
16,456
1.6%
2010
23.2M
166.9K
10.7%
19,197
1.6%
2015
23.5M
213.6K
12.5%
22,780
1.8%
2019
23.6M
—
—
—
—
2020
23.6M
165.2K
16.1%
28,705
1.6%
2025
23.3M
107.8K
20.1%
39,515
1.4%
Sources: Department of Household Registration (year-end population, births, population by age group); DGBAS national accounts (GDP per person, industry structure). Population and births before 1975 exclude Kinmen and Lienchiang (the 1963 birth figure is the national total including them). GDP per person is converted to US dollars at each year's exchange rate; the fall from 1955 to 1960 reflects the exchange rate. Industry shares for 1960–1980 use an older national-accounts definition and should not be compared directly with later figures.
Births have halved. Who feels it first?
In 1963, 427,000 babies were born in Taiwan, the most in any year on record. Four or five children was ordinary for that generation of parents: the total fertility rate in 1960 was 5.75.
Sixty-odd years later, 2025 saw 107,812 births, a quarter of that peak. Fertility fell below the 2.1 needed to keep the population stable in 1984 and has never returned to it; 0.695 in 2025 is the lowest ever recorded.
The most direct reason is that fewer people marry. Almost every child in Taiwan is born within marriage (births outside it are only 2–4%), so when marriages fall, births follow a few years later. In 2025, 104,376 couples married, 15.2% fewer than the year before.
Births move forward like a wave: children not born today are missing from primary school six years later, and from university, the army and the workforce about eighteen years later. The wave has already passed through primary schools and is now reaching universities. Meanwhile, at the end of 2025 people aged 65 and over passed a fifth of the population, making Taiwan a super-aged society.
In seventy years, under-15s fell from 43% to 11% of the population and over-65s rose from 2% to 20% (% of total)
Ages 0–1415–6465 and over
1955
43.41
54.14
1975
35.37
61.13
1995
23.77
68.60
2015
13.57
73.92
12.51
2025
11.51
68.43
20.06
In seventy years, under-15s fell from 43% to 11% of the population and over-65s rose from 2% to 20% (% of total)
Year
Ages 0–14
15–64
65 and over
1955
43.41
54.14
2.45
1975
35.37
61.13
3.50
1995
23.77
68.60
7.64
2015
13.57
73.92
12.51
2025
11.51
68.43
20.06
Source: Department of Household Registration, year-end population by age group; figures before 1975 exclude Kinmen and Lienchiang
Why it matters: what this number sets in motion
01 Primary schools
By 2026, 110 primary schools across Taiwan had so few first-graders that they could open only one class.
What to watch next The 107,812 children born in 2025 start primary school in 2031 and reach university age in 2043. How schools merge or change, how migrant workers and new immigrants settle in Taiwan, and how long-term care and labour insurance are funded can all still be decided before the wave arrives.
How did Taiwan become the chip island, and what has it cost?
After the war Taiwan earned foreign exchange first from rice and sugar; its industrial exports started with processing work for others: on 3 December 1966 the Kaohsiung Export Processing Zone opened, where firms imported raw materials, processed them and exported everything. Hsinchu Science Park opened on 15 December 1980, and in February 1987 TSMC was founded on a new model, the pure-play foundry that makes chips for others and sells no brand of its own.
In 2025, machinery and electrical equipment (the category that includes chips, servers and computers) made up 80% of exports, up from 55% in 2001. Exports of ICT and audio-visual products reached US$251.15 billion, 89.5% more than the year before. In the second quarter of 2026, TSMC took 72.5% of the revenue of the world's ten largest foundries.
Chip fabs need steady power, a great deal of water and crowds of engineers, and the more the industry expands, the more often those resources have to be shared with farming and traditional industry.
Chips gave Taiwan something the whole world needs, and exports, the stock market and electricity now revolve around a single industry: at the end of September 2026, TSMC alone was about 41% of the listed market's value. That concentration is Taiwan's leverage, and it also ties Taiwan's fortunes to one industry.
Machinery and electrical equipment rose from 55% of exports in 2001 to 80% in 2025 (%)
Machinery and electrical equipment rose from 55% of exports in 2001 to 80% in 2025 (%)
Year
Machinery and electrical equipment
2001
55.2
2005
49.7
2010
48.1
2015
52.6
2020
63.2
2024
73.2
2025
80.4
Source: Ministry of Finance, Department of Statistics, trade statistics (HS Section XVI, which includes chips, servers and computers, divided by total exports)
Why it matters: what this number sets in motion
01 Electricity
TSMC used 24.775 billion kWh in 2023, 8.96% of Taiwan's total. S&P projects it could reach 23.7% by 2030.
TSMC uses more than 200,000 tonnes of water a day, and almost all 81,000 tonnes a day from Tainan's four water-recycling plants go to it. Chianan farmland stopped irrigating in 2021 and again in 2023.
The screw and fastener industry is squeezed for both workers and electricity; owners say young people would rather join high-tech fabs, leaving no one to take over.
TSMC makes about 90–92% of the world's chips at 5 nanometres and below. In its annual report to the US SEC, NVIDIA lists its concentration in the Asia-Pacific and its reliance on TSMC as risks.
What to watch next Chip orders follow AI, and the statistics agency forecasts 11.05% growth for 2026. What to watch is whether power and water can keep up: renewables were 13.3% of generation in 2025, and the green power global customers demand has to be produced in Taiwan.
The economy grew 8.76% in 2025. Where did the money come from, and where did it land?
Taiwan's economy grew 8.76% in 2025, the fastest since 2010, and GDP per person reached US$39,515. In the same year total exports rose 34.9%, and sales of ICT and audio-visual products alone rose by more than US$110 billion.
From 2000 to 2025, real GDP per person grew 2.4 times, while employees' real regular monthly earnings rose only 5.5%, and barely moved at all between 2000 and 2020. Nominal pay rose 41% over the same period; most of it was eaten by prices.
Who the growth reaches shows in the gap between industries: fewer than one worker in ten is directly employed in the AI, semiconductor and electronics supply chain, and a restaurant worker's total monthly pay is only 34.6% of that in electronic-component manufacturing.
The floor has moved faster than the middle: from 2016 to 2024 the minimum wage rose 37% while median pay rose 18%. The 2026 minimum wage is NT$29,500 a month, rising to NT$30,900 from 2027.
Over 25 years, real GDP per person grew 2.4 times while real monthly pay rose only 5.5% (2000 = 100)
Over 25 years, real GDP per person grew 2.4 times while real monthly pay rose only 5.5% (2000 = 100)
Year
Real GDP per person
Real regular pay
2000
100
100
2005
119.2
100.8
2010
144.7
97.3
2015
164.7
98.9
2020
190.4
104.1
2025
243.8
105.5
Source: DGBAS national accounts (chained real GDP divided by mid-year population) and earnings statistics (real regular monthly earnings of all employees in industry and services, 2021 prices). The two use different price deflators, so compare direction only; pay excludes bonuses and overtime
Why it matters: what this number sets in motion
01 Income distribution
In January 2026, economist Min-Hua Chiang wrote that the top 10% of earners receive 48% of all income in Taiwan and the bottom 50% only 12%.
Seventy percent of employees earn less than the average wage; the share has risen six years in a row and passed 70% for the first time in the first half of 2026.
At the 2025 minimum-wage review, employers argued growth came from chips while traditional industries and services were struggling; labour said low earners feel prices more. The council settled on 3.18%.
What to watch next Whether growth reaches most people depends on three numbers moving together: median pay, the minimum wage and real wages after inflation. Median pay for 2025 is published at the end of November.
In 1948, tenant farmers made up about 38.7% of farming households in Taiwan. Land reform put the land in the hands of owner-farmers, and by 1965 the share of tenant households had fallen to 12.61%; today's pattern of small family farms starts here.
Over the following sixty years the dinner table changed: in 2001 each person ate 50.1 kg of white rice a year, in 2025 41.8 kg, and meat now comes to 86.8 kg per person a year, by weight almost as much as all grains.
Measured in calories, food self-sufficiency was 55.6% in 1984, fell below 40% for the first time in 1992 and stood at 30.4% in 2025: seven in ten calories are imported. Rice is the exception, with a self-sufficiency rate of 107.3% in 2025, more than the country eats; the whole shortfall lies in crops other than rice.
Food self-sufficiency, measured in calories, fell from 55.6% in 1984 to 30.4% in 2025 (%)
Food self-sufficiency, measured in calories, fell from 55.6% in 1984 to 30.4% in 2025 (%)
Year
Self-sufficiency
1984
55.6
1989
45.41
1994
38.49
1999
35.76
2004
32.05
2009
31.85
2014
34.19
2019
32.24
2024
30.78
2025
30.36
Source: Ministry of Agriculture, food self-sufficiency (calories) open data, current revised series
Why it matters: what this number sets in motion
01 Industry
In 2024, primary farming, forestry, fishing and livestock were just 1.5% of GDP, employing 490,000 people. Counting food manufacturing, wholesale, retail and restaurants, the whole agri-food chain was 6.8% of GDP.
What to watch next Three things to watch: whether self-sufficiency holds above 30%, where the next generation of farmers comes from, and who gets the water first in the next drought.
More than thirty years after martial law, what does Taiwan's democracy look like in numbers?
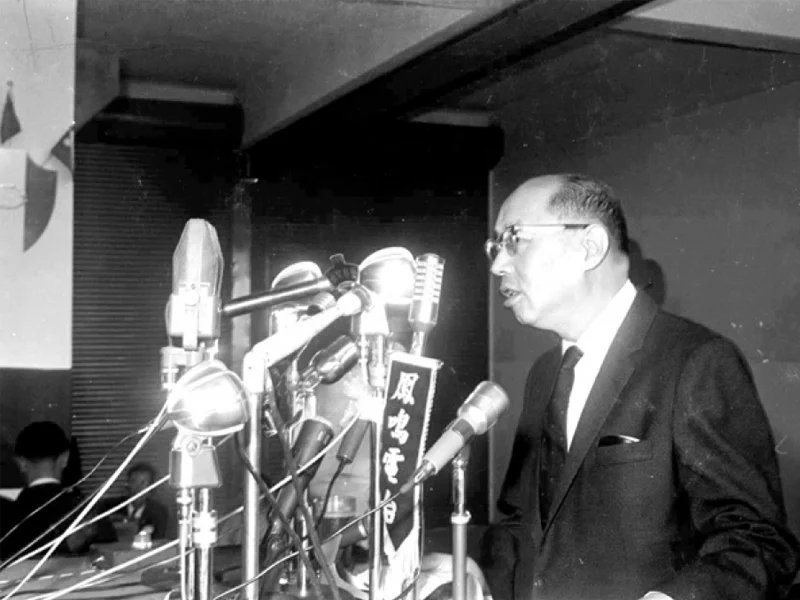
From 20 May 1949, Taiwan was placed under martial law; it was lifted at midnight on 15 July 1987, thirty-eight years later. In those years assembly, association, publishing and elections were restricted, and political cases were tried by military courts.
After martial law, it took Taiwan only nine years to go from lifting the newspaper ban and fully re-electing its legislature to a direct presidential election in 1996; the first change of ruling party came in 2000.
Measured by international yardsticks today, Freedom House gives Taiwan 93 points in 2026: 38 of 40 for political rights and 55 of 60 for civil liberties. In Reporters Without Borders' press freedom index, Taiwan ranked 28th in 2026, down four places. Turnout across eight presidential elections has ranged from 66.27% to 82.69%; in 2024 it was 71.86%.
This democracy is less than forty years old counting from the end of martial law, and many of its rules are still being settled: the thresholds for recalls and referendums, how archives from the martial-law era are opened, how press freedom is protected. Where each threshold is set decides how many votes it takes for a result to count.
1947
The 228 Incident
A clash over contraband cigarettes in Taipei on 27 February; the next day strikes, shop closures and petitions spread across Taiwan
1949
Martial law
Declared across Taiwan Province from 20 May
1987
Martial law lifted
From midnight on 15 July in the Taiwan area
1991
Period of Mobilization ends
Ended at midnight on 1 May; constitutional amendments promulgated the same day
1992
Legislature fully re-elected
Article 100 of the Criminal Code amended in May; first full election of the Legislative Yuan in December
1996
First direct presidential election
Voting on 23 March, turnout 76.04%
2000
First change of ruling party
A president from a different party took office on 20 May
2005
National Assembly abolished
Constitutional amendments now go to a public referendum
2019
Same-sex marriage
The act implementing Judicial Yuan Interpretation No. 748 took effect on 24 May
Source: National Human Rights Museum, National Archives Administration, Legislative Yuan Parliamentary Museum, Laws & Regulations Database, Office of the President, Central Election Commission
Why it matters: what this number sets in motion
01 Courts
Over the 38 years of martial law, military courts tried 29,407 criminal cases against civilians.
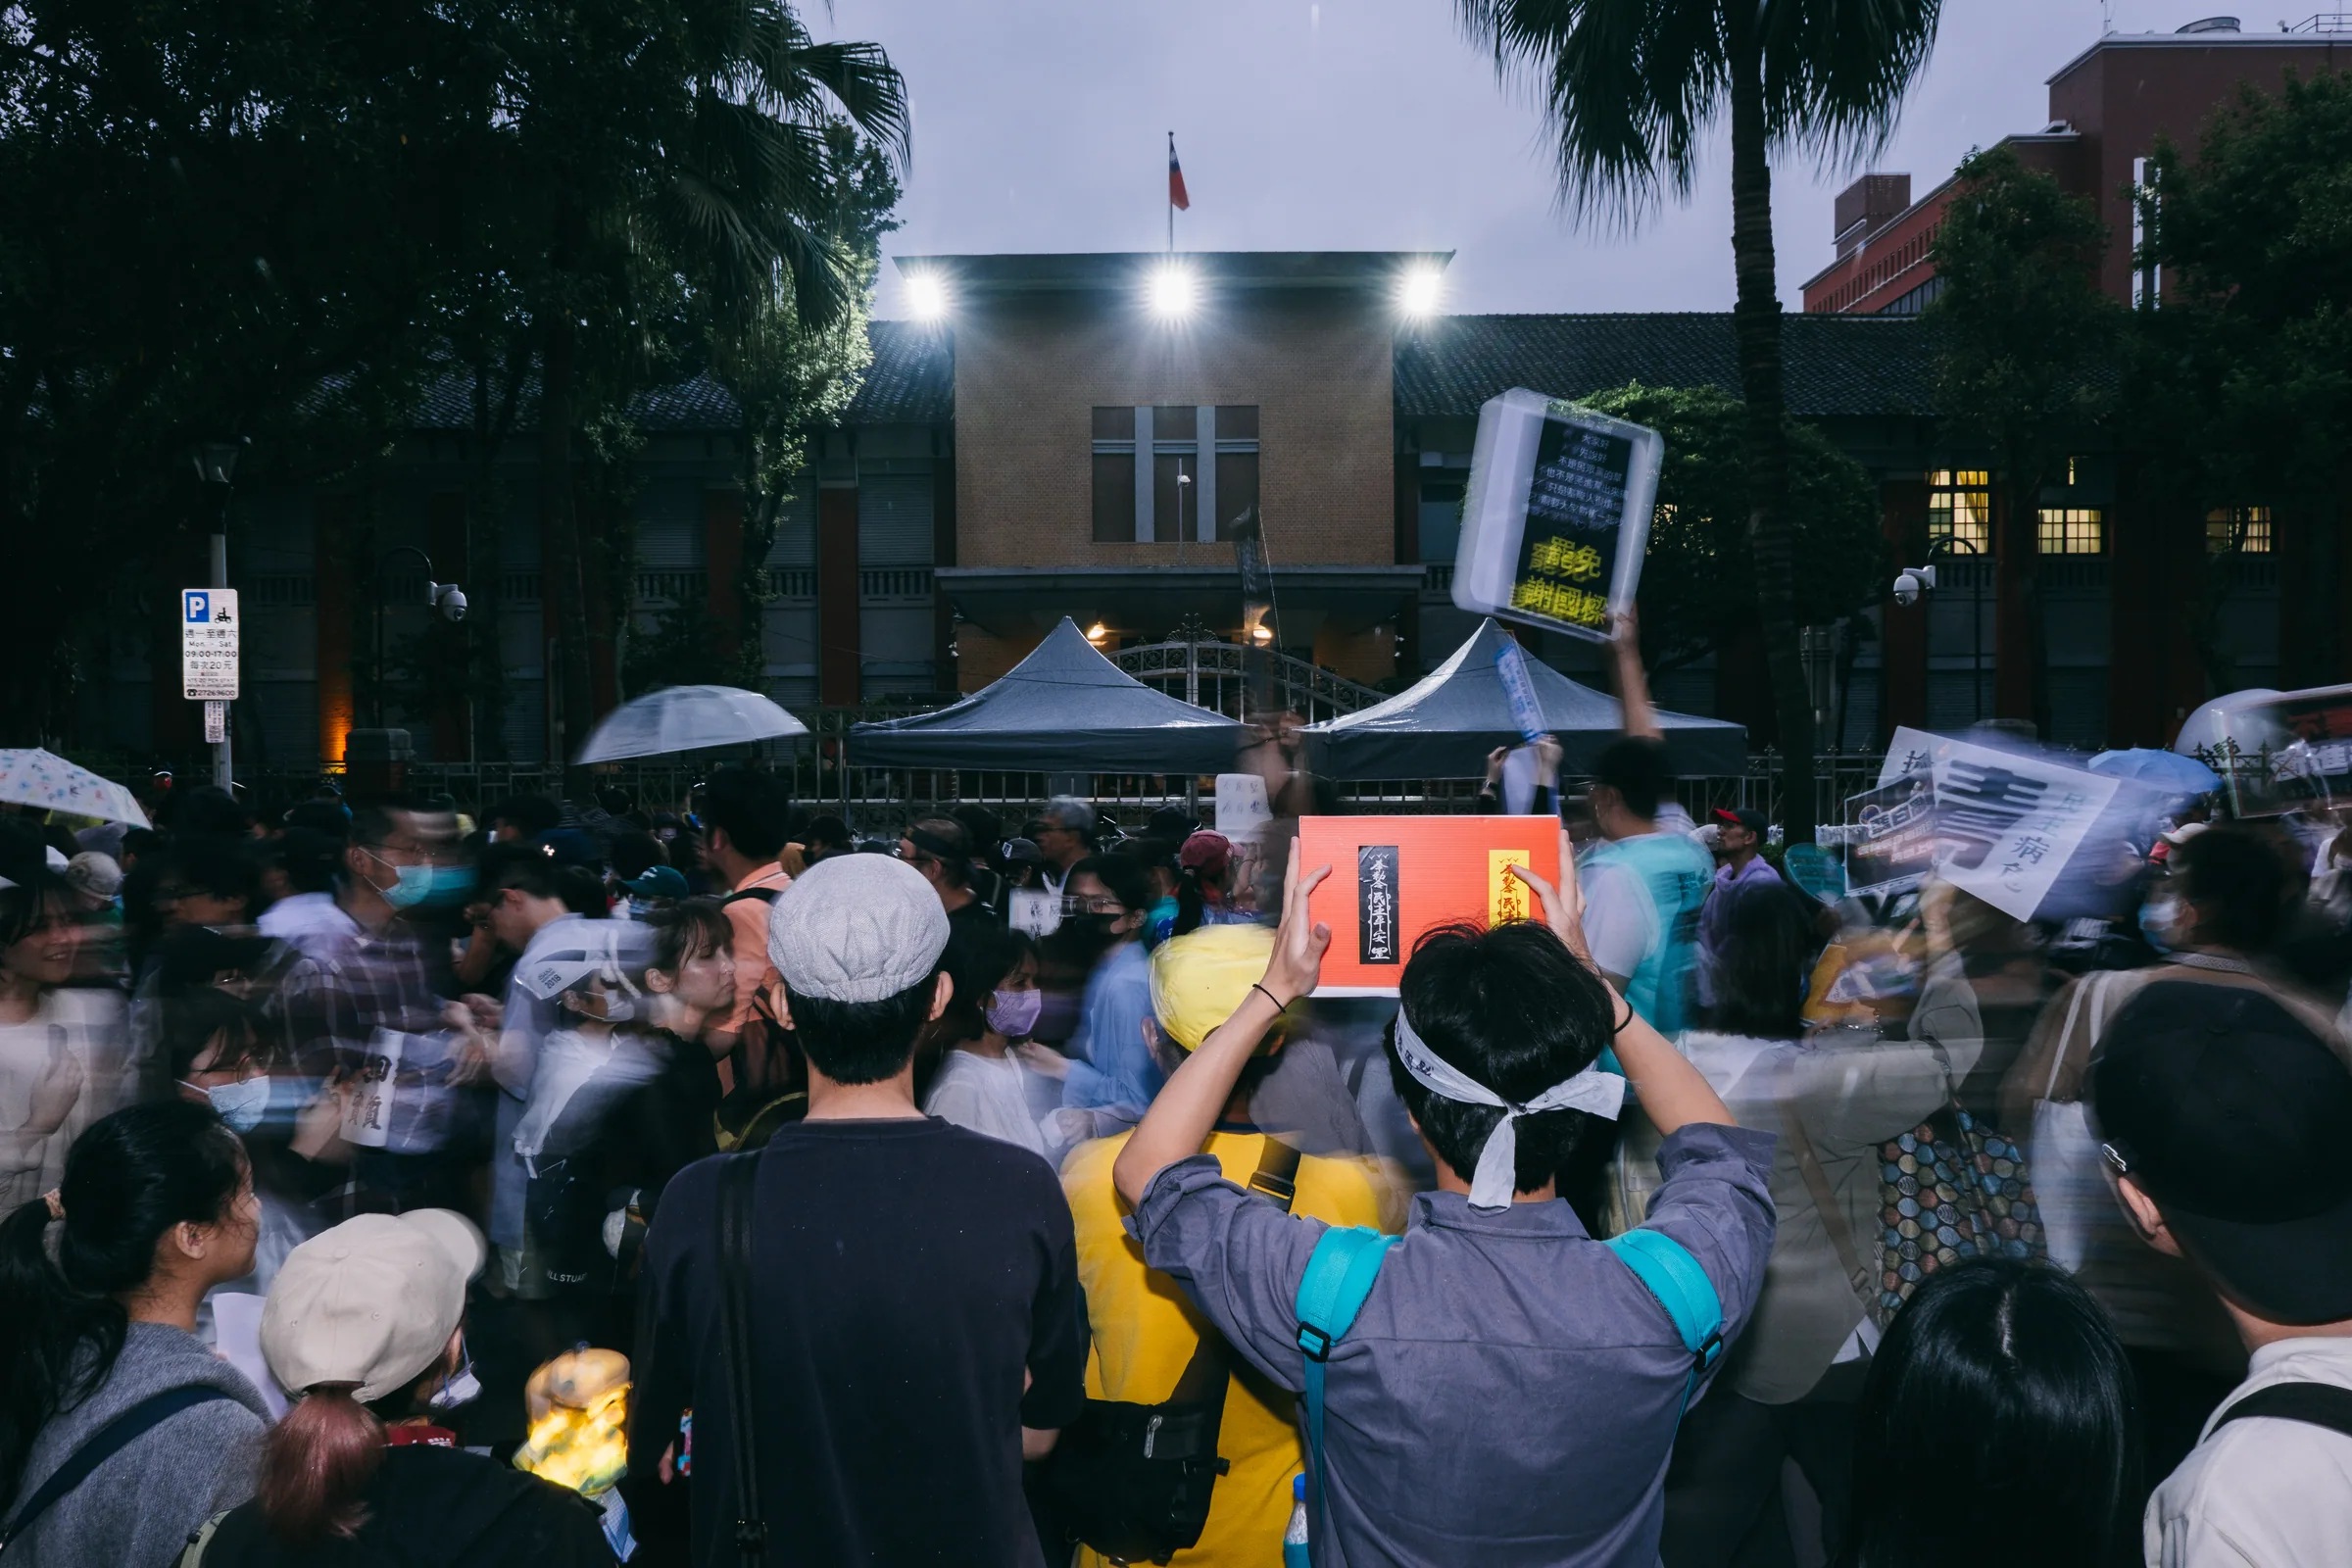
Turnout in the 2025 mass recall votes was 55.83%, a record for recalls, yet all 25 failed. In a referendum the same day on the Maanshan nuclear plant, 4.34 million voted yes, 74.17% of votes cast, but that fell short of the threshold of a quarter of all eligible voters (about 5 million).
How much terrain and life fits on an island of 36,000 km²?
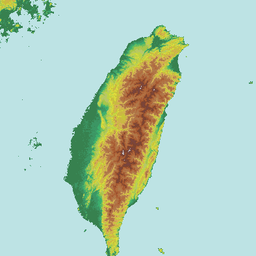
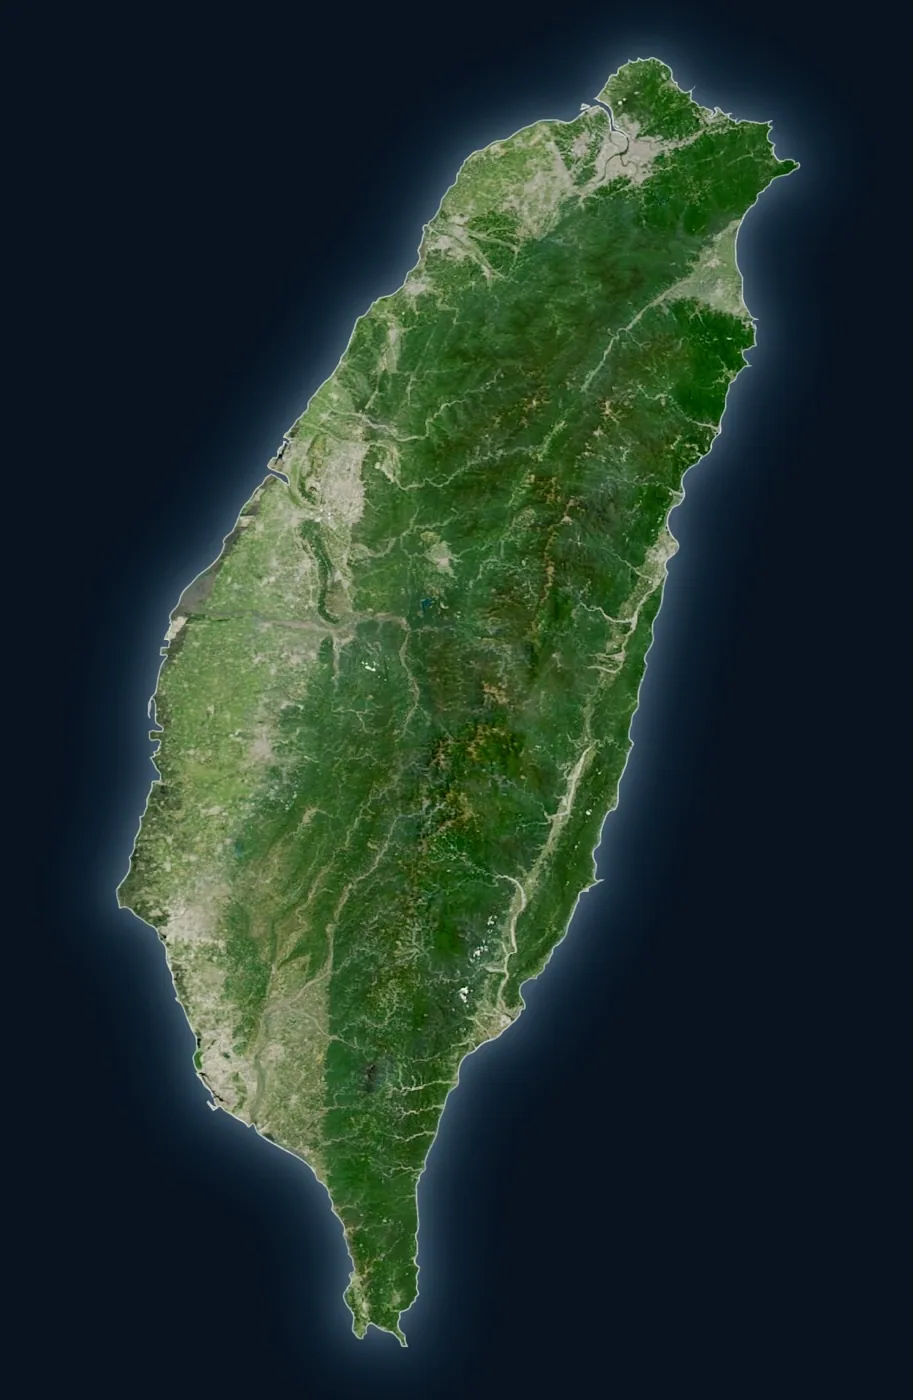
Mountains, hills and terraces make up nearly 70% of Taiwan's main island, and Yushan's main peak stands 3,952 metres high. Sea level to nearly 4,000 metres is packed into 36,000 square kilometres, so rivers are short and fast. Average rainfall of about 2,500 mm a year is more than double the world average, yet the water runs quickly back to the sea.
People live close together: at the end of 2025 the six special municipalities held 69.87% of the population on 30.12% of the land, and the national average is 644 people per square kilometre.
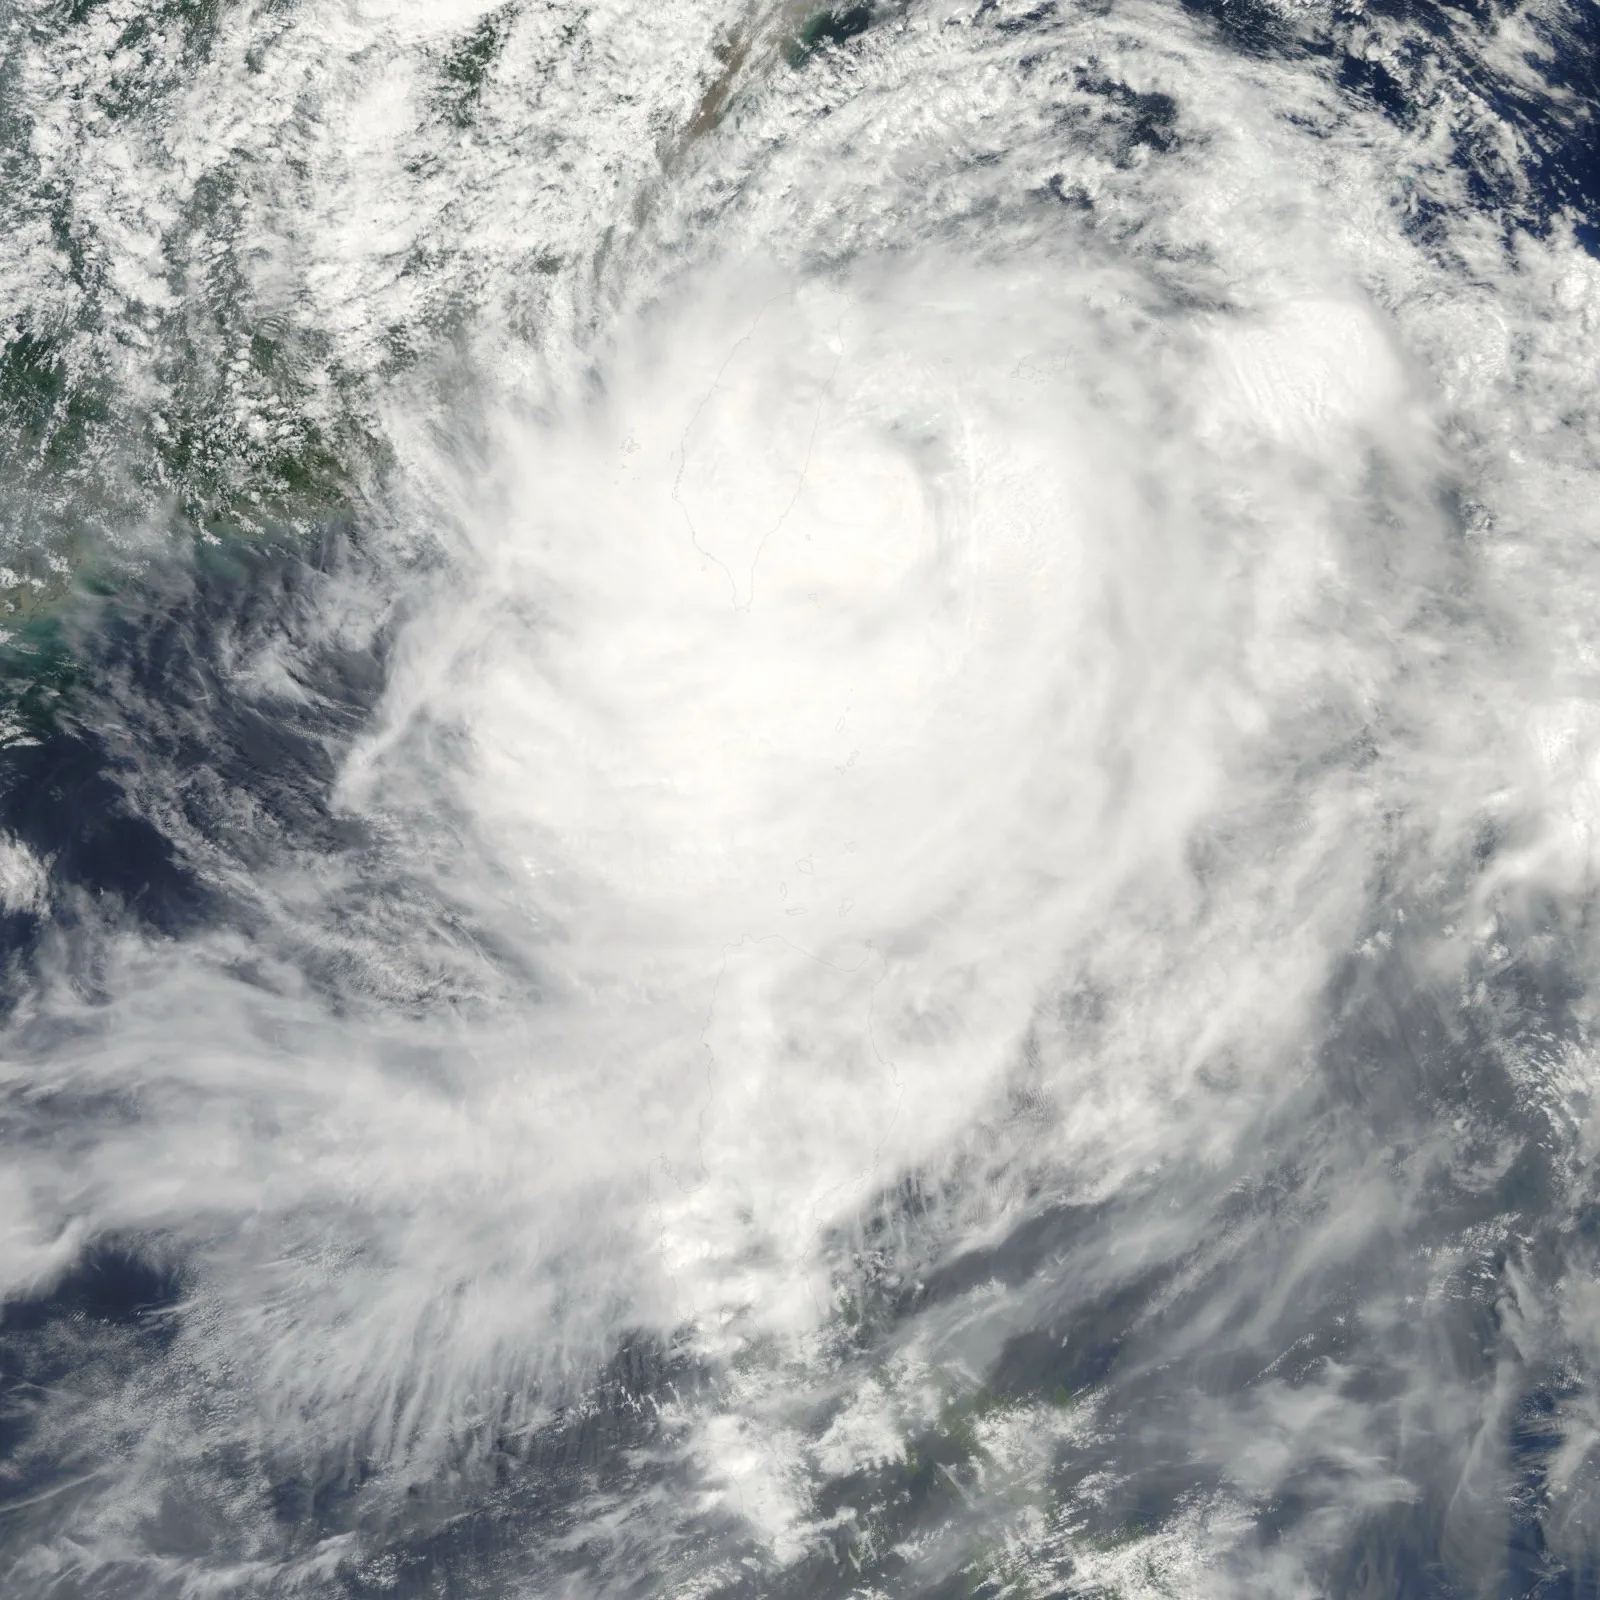
From 1911 to 2025, 382 typhoons struck Taiwan, three or four in a typical year, and heavy typhoon rains often set off landslides.
More than 66,000 species have been recorded in Taiwan (introduced species included), nearly 10,000 of them endemic, and six-tenths of the land is forest.
Population density in 22 counties and cities: Taipei has 8,975 people per km², Taitung 59 (national average 644)
Lienchiang473
Taipei8,975
Keelung2,710
Taoyuan1,929
New Taipei1,971
Yilan210
Kinmen919
Hsinchu City4,376
Hsinchu County418
Miaoli292
Taichung1,295
Hualien68
Changhua1,126
Nantou114
Penghu841
Yunlin504
Chiayi City4,358
Chiayi County249
Tainan845
Kaohsiung921
Pingtung282
Taitung59
598,975
Population density in 22 counties and cities: Taipei has 8,975 people per km², Taitung 59 (national average 644)
County
Value
Taipei
8,975
Hsinchu City
4,376
Chiayi City
4,358
Keelung
2,710
New Taipei
1,971
Taoyuan
1,929
Taichung
1,295
Changhua
1,126
Kaohsiung
921
Kinmen
919
Tainan
845
Penghu
841
Yunlin
504
Lienchiang
473
Hsinchu County
418
Miaoli
292
Pingtung
282
Chiayi County
249
Yilan
210
Nantou
114
Hualien
68
Taitung
59
Source: Department of Household Registration, township population and land area at the end of 2025, summed by county
Why it matters: what this number sets in motion
01 Typhoons
Farm losses in 2024 totalled NT$52.65 billion, 98.88% of it from typhoons, almost all from Gaemi, Krathon and Kong-rey.
Academia Sinica simulations suggest that by the end of the century only one or two typhoons a year may affect Taiwan, but the share of Category 4 and stronger storms could rise by more than 150% and rainfall intensity by 40%.
What to watch next What to watch is how the maps of people and hazards overlap: seven in ten people live in the six municipalities, yet the highest ageing indexes are in Chiayi County, Kinmen County and Keelung City. Where rescue and care workers should be placed as typhoons grow stronger is the next question.
How do people in Taiwan get around, and how do they pay?
High-speed rail opened in 2007, cutting Taipei to Kaohsiung to about an hour and a half. It carried 30.58 million passengers in 2008 and 82.07 million in 2025, about 225,000 a day. The Taipei metro adds 2.1 million trips a day.
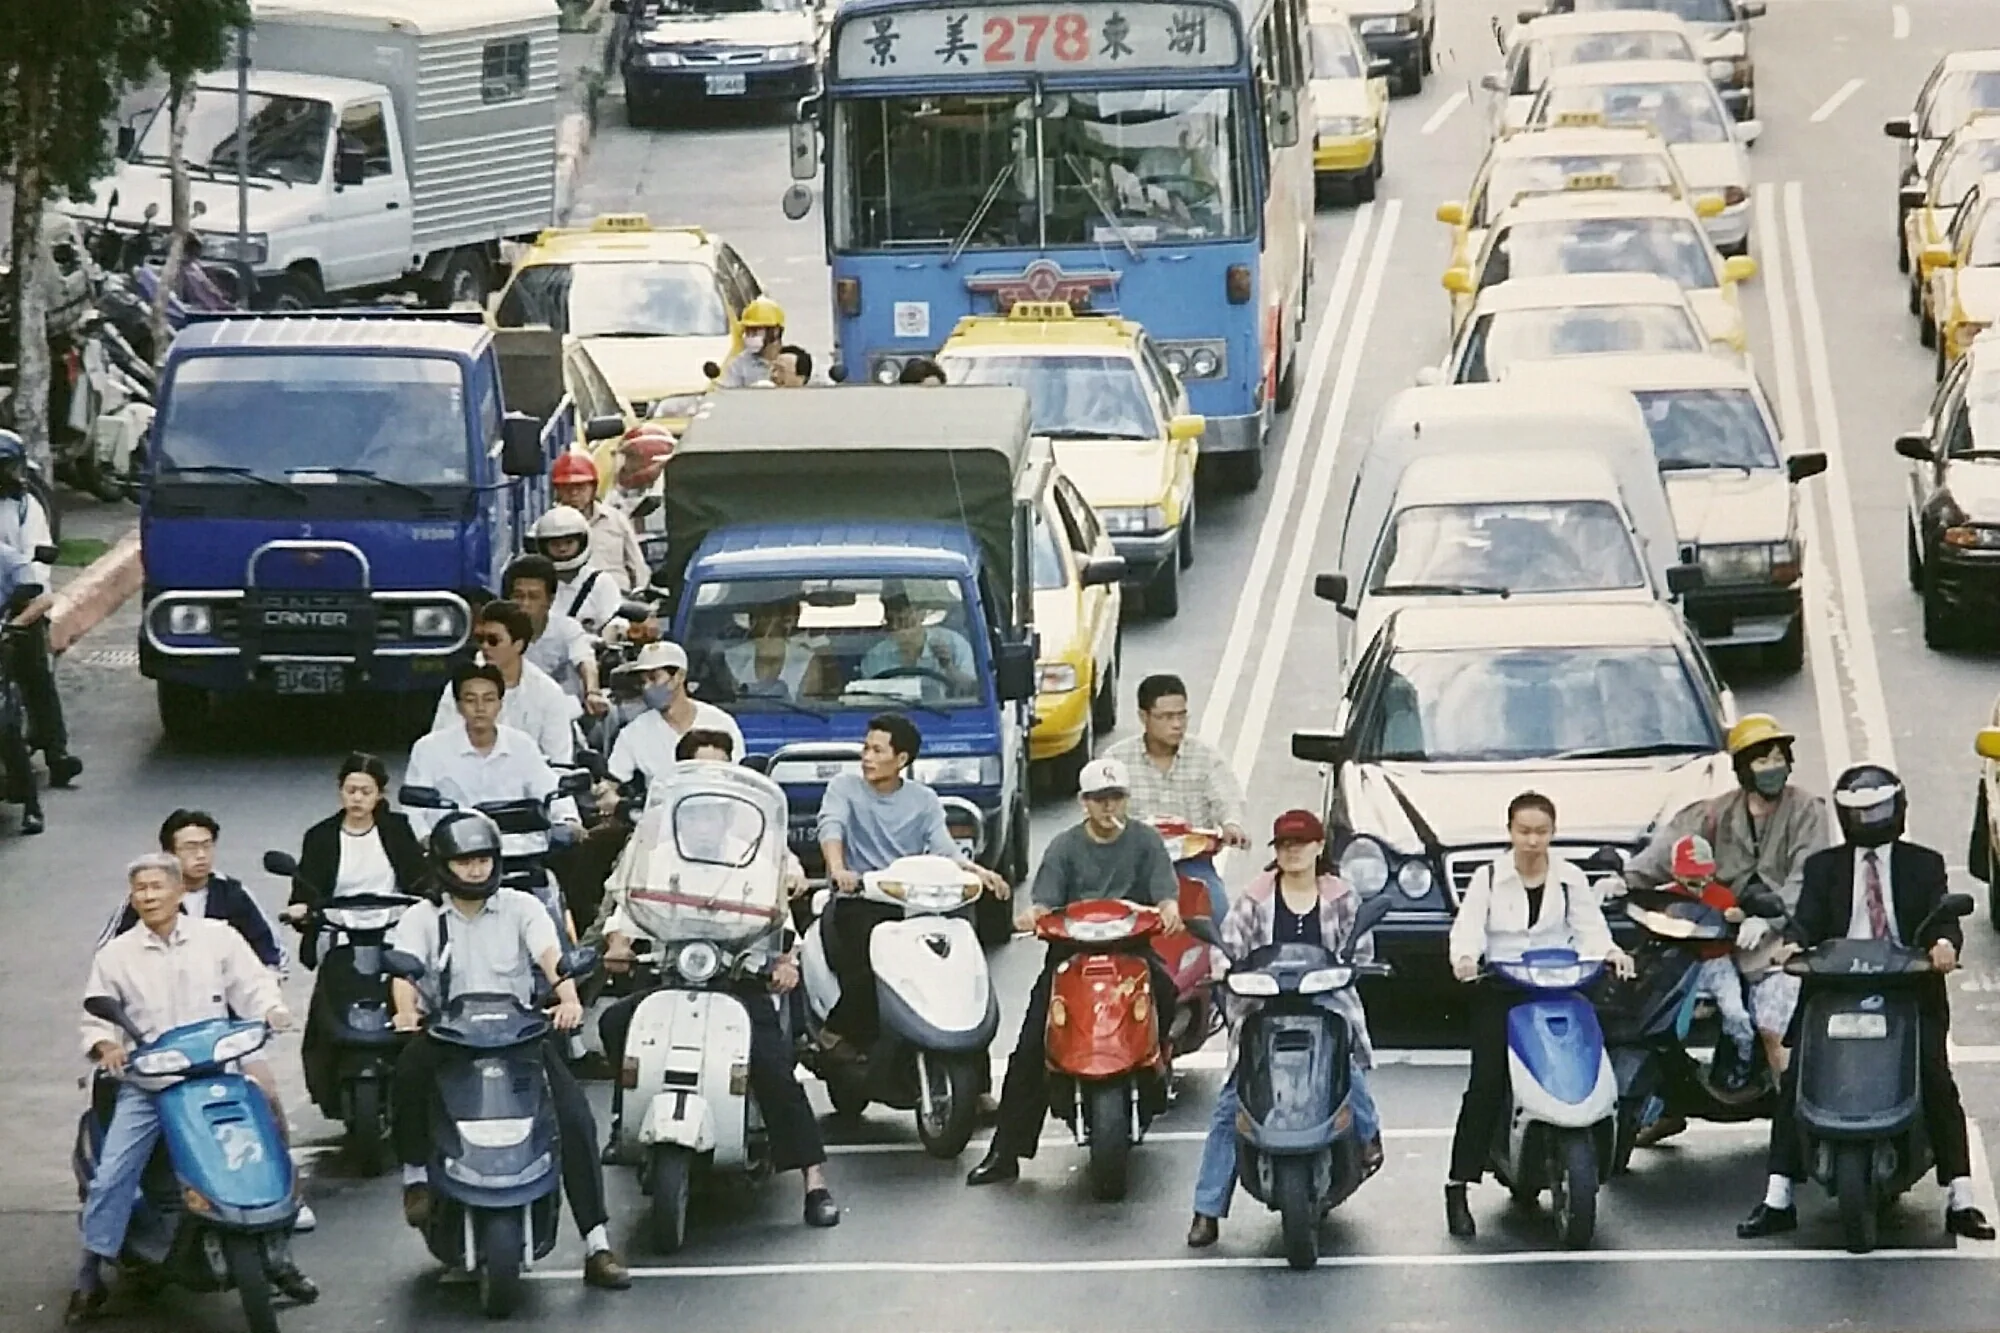
Scooters are still part of daily life for many: at the end of 2025 there were 14.67 million registered scooters, about 630 for every 1,000 people.
The way people pay is changing too: in 2025 more than half of internet users used mobile payment for the first time, and in retail and restaurants mobile payment's share of spending rose from 0.6% in 2017 to 11.2% in 2023, while cash fell from 41.1% to 23.0%.
High-speed rail passengers grew 2.7 times in seventeen years, dipping only in the two pandemic years (10,000 trips)
High-speed rail passengers grew 2.7 times in seventeen years, dipping only in the two pandemic years (10,000 trips)
Year
Passengers
2008
3058
2009
3235
2010
3694
2011
4163
2012
4453
2013
4749
2014
4802
2015
5056
2016
5659
2017
6057
2018
6396
2019
6741
2020
5724
2021
4346
2022
5416
2023
7309
2024
7825
2025
8207
Source: Taiwan High Speed Rail Corporation annual and operating reports
Why it matters: what this number sets in motion
01 Town and country
High-speed rail runs 12 stations along the western plains and carried about 78.25 million passengers in 2024. The east and the outlying islands are not on the network.
What to watch next What to watch: whether rural bus driver numbers recover, and whether cash-only vendors and cash-only customers are left behind as payments switch over.
Every number should answer three questions: who measured it, for which year, and where to check it
66 key numbers about Taiwan from 32 institutions, each with its source and period
Grouped by the topics used across this site. Each card shows the latest published value with an earlier comparison below it. Cards marked "industry estimate", "projection" or "international ranking" are not government statistics, so mind how they were measured before citing them. The # in the corner of each card is a permanent link to that number.
Past its peak at the end of 2019 and drifting down since, about 390,000 below the high.
Why it matters From 2015 to 2025 the total population fell by only 190,000, but the mix shifted far more: people aged 15–64 fell by 1.42 million while those 65 and over grew by 1.73 million. Fewer people paying taxes and premiums, more people needing care.
Half the number of ten years ago, and 27,000 fewer than the year before.
Why it matters This year's births largely decide how many students finish high school 18 years later, and how many conscripts and new workers follow. The 107,812 babies of 2025 reach university age in 2043.
A woman has fewer than 0.7 children on average over her lifetime; holding the population steady takes about 2.1.
Why it matters Below 2.1, each generation is smaller than the one before. Taiwan fell under 2.1 in 1984 and has never gone back; at 0.695 the next generation is roughly a third the size of this one.
Deaths have outnumbered births since 2020 and the gap keeps widening: 200,000 deaths against 108,000 births in 2025.
Why it matters Once deaths outnumber births, the registered population can only hold steady through people who settle and register here, such as naturalised immigrant spouses and citizens returning from abroad. Natural decrease alone was 92,000 in 2025.
It crossed 20% at the end of December 2025, making Taiwan a super-aged society; under-15s are down to 11.2%.
Why it matters Above 20% means one person in five is 65 or older, and spending on care, healthcare and pensions rises with it. By April 2025, 215,000 foreign caregivers were looking after Taiwan's elderly.
Half the population is older than 45.7; for Indigenous peoples the median is 34.9, almost 11 years younger.
Why it matters Half the population is over 45.7, so the centre of gravity of voting, work and spending moves older too. Indigenous peoples are nearly 11 years younger, so the pressure of ageing falls unevenly.
84.75 for women and 77.93 for men, with a seven-and-a-half-year gap between Taipei (83.98) and Taitung (76.49).
Why it matters Long lives reflect healthcare and living conditions, and they decide how many years pensions must be paid. Counties differ by seven and a half years: people in Taitung live on average more than seven years less than people in Taipei.
Down 15.2% on the year; 3,305 were same-sex couples, and in 18.5% one partner was foreign or from China, Hong Kong or Macau.
Why it matters Almost every child in Taiwan is born within marriage (births outside it are only 2–4%), so when marriages fall, births follow a few years later. Marriages dropped 15.2% in 2025.
Taiwan was the first in Asia to legalise same-sex marriage. The cumulative total is our sum of the annual registrations; women couples outnumber men every year.
Why it matters This counts how often a right that did not exist before 2019 has been used. Each registration gives a couple legal spouse status in household registration, inheritance and medical decisions.
393,700 from China, Hong Kong and Macau and 229,000 from other countries, mostly women; the mainland figure counts permit applicants.
Why it matters 622,000 spouses and their children mean many Taiwanese families are transnational from the start. In 2025, 18.5 of every 100 marrying couples included a foreign or mainland, Hong Kong or Macau spouse.
Up almost 50% in ten years, with Indonesia, Vietnam and the Philippines making up 91%; the total is our sum of the ministry's rows by nationality.
Why it matters As births fall and the workforce shrinks, factories, construction, fishing and home care lean on migrant workers. The National Development Council estimates the talent gap will widen to 480,000 by 2030.
2.7% of the population across 16 recognised peoples, the Amis largest at 235,000; numbers jumped by 23,000 in 2024 for reasons the ministry has not explained.
Why it matters The Indigenous population grew by 76,000 between 2016 and 2025, and its median age is nearly 11 years below the national figure. Language revival, education and traditional-territory policies serve a population that is growing and younger.
Down from 4.16 people per household in 1991 to under 2.7 today.
Why it matters Households shrank from 4.16 people in 1991 to under 2.7, so fewer family members share the work of caring. The same population needs more homes, and more care is handed to paid caregivers and long-term care services.
110,000 fewer in ten years; tertiary enrolment fell from 1.33 million to 1.06 million, and the number of institutions from 152 to 139 in five years.
Why it matters Universities that cannot fill their seats close: the Ministry of Education projects only 151,000 first-year students in the 2041 academic year, and the 17 private colleges that recently shut left 1,064 staff behind.
77.17% for the poorest fifth of households and 91.46% for the richest; 7.62% of households rent.
Why it matters With 84% of households owning their home, house prices move most families' wealth. For the poorest fifth, ownership is 14 points lower, and prices are a barrier rather than an asset.
A median-income household buying a median home (NT$9.8 million) would spend 43% of disposable income on the mortgage each month.
Why it matters A median-income family buying a median home spends 43 of every 100 dollars of disposable income on the mortgage. That share decides how much is left for raising children and saving for retirement.
The richest fifth of households have 6.17 times the disposable income of the poorest fifth, or 3.73 times per person; the median household has NT$1.018 million.
Why it matters This is the ruler the government uses each year to check whether income distribution is improving. Per person the ratio falls to 3.73, so part of the gap comes from household size: larger households naturally have higher total incomes.
Japan sent the most visitors, 1.48 million; the same year residents made 18.94 million trips abroad, 2.2 times as many.
Why it matters Visitor spending goes to hotels, restaurants and transport and supports jobs across the country. Taiwanese make more than twice as many trips abroad as visitors make to Taiwan; that gap is the room Taiwan's tourism still has to grow.
2024 Summer Olympics (competing as "Chinese Taipei")
The golds came from Lee Yang and Wang Chi-lin in men's doubles badminton and Lin Yu-ting in women's 57 kg boxing.
Why it matters Taiwan competes at the Olympics as "Chinese Taipei" under the plum-blossom Olympic flag, not its national flag. On the night Lee Yang and Wang Chi-lin won gold in Paris in 2024, the crowd sang the words of the National Flag Anthem as the Olympic flag rose.
405,000 unemployed and 11.64 million employed, with labour force participation at 59.59%.
Why it matters A low rate only says that most people looking for work find it. The participation rate of 59.59% is the other half: people who are retired, caring for family or studying are not looking, so they are not counted.
Half of employees earn less than NT$546,000 a year, about NT$45,500 a month; women NT$512,000, men NT$585,000. The 2025 figure is due in late November.
Why it matters The median is closer to what an ordinary worker earns than the average is. From 2016 to 2024 the minimum wage rose 37% while the median rose 18%, so the floor is closing in on the middle.
NT$196 an hour; the ministry has announced NT$30,900 a month and NT$205 an hour from 2027, the eleventh rise in a row.
Why it matters Each year a council of labour, employers and academics sets the minimum wage, the first channel through which growth reaches the lowest-paid. In 2025 employers argued growth came from chips while traditional industries and services were struggling; the council settled on a 3.18% rise.
For employees in industry and services, 160.1 of them regular hours; industry works longer, at 175.1 hours.
Why it matters 168.9 hours a month is about 2,027 a year. Working hours decide how much time is left for family, study and rest, and industry works longer hours than services.
The highest since 2010 (10.25%); in August the statistics agency forecast 11.05% for 2026.
Why it matters Exports surged that year, with ICT and audio-visual products up 89.5%. Fewer than one worker in ten is directly employed in the AI, semiconductor and electronics supply chain, so most people felt far less change than 8.76% suggests.
NT$28.7 trillion in local currency; up more than 70% in dollar terms over ten years, about US$121 billion of it in the last year alone.
Why it matters GDP is the total value produced in a year and the denominator for how much a state can tax and borrow. Defence spending and public debt are both measured as shares of it.
Up US$16,735 in ten years. This is output divided by population, which is a different thing from what a typical worker earns (see the median wage under Society).
Why it matters This is the yardstick most often used to compare living standards across countries. It divides everything, corporate profits and government revenue included, by population, so it can run ahead of what ordinary people take home; read it alongside median earnings.
In the same year growth hit a record, inflation eased back to 1.66%.
Why it matters Inflation is what every pay rise is measured against: if wages grow slower than prices, people can buy less. That is why, in minimum-wage talks, academic members argue that inflation should be the floor.
Up 34.9% in a year, with imports also at a record; the trade surplus of US$157.1 billion was a record too.
Why it matters Taiwan's economy runs on exports, and a 35% jump pushes growth up with it. The flip side is concentration: electronic components and ICT products make up 74%, so a turn in the global cycle would hit just as narrowly.
Compared with 26.6%(China and Hong Kong, same year)
The US overtook China and Hong Kong as Taiwan's largest export market, which the Ministry of Finance says is the first time in 26 years.
Why it matters With the United States now the biggest buyer, US tariffs, export controls and industrial policy directly shape Taiwan's orders and investment decisions.
The same release notes that foreign holdings of Taiwanese stocks, bonds and NT dollar deposits equal US$1.93 trillion, about 3.2 times the reserves.
Why it matters Foreign-exchange reserves are the central bank's ammunition for steadying the New Taiwan dollar. Foreign holdings of Taiwanese stocks, bonds and deposits are 3.2 times larger, so when foreign money moves, the currency and the stock market move together.
Up NT$62 trillion in nine months. TSMC alone is worth NT$64.3 trillion, about 41% of the total (our division of two exchange figures).
Why it matters Anyone invested in Taiwanese stocks, directly or through an ETF, is tied closely to TSMC: it alone is about 41% of the listed market, so when its share price moves, the whole market moves.
About 3.5 times its level ten years earlier; by the end of September 2026 it had closed at 47,940.
Why it matters Up about 3.5 times in ten years: households holding shares saw their wealth swell, households without them did not. When assets outpace wages, owning stocks becomes a new dividing line between families.
Gas has replaced coal as the largest source; coal fell from 45.9% to 35.3%, out of 289.7 billion kWh generated in the year.
Why it matters Natural gas arrives almost entirely by ship, and the legal safety stock is about 11 days. With gas producing nearly half the electricity, the power supply is tied to sea lanes.
From 12.7 to 38.6 billion kWh in ten years, with the mainstay shifting from hydro to solar (43.4%) and wind.
Why it matters Renewables are electricity Taiwan makes for itself, up from 4.8% to 13.3% in ten years. Major global customers ask suppliers to produce with green power, so this share also decides whether Taiwanese products keep their place in supply chains.
Still 1.1% for 2025 because the last plant ran until mid-year; a full year at zero starts in 2026.
Why it matters The last nuclear plant shut down in mid-2025. In a referendum that year on restarting it, 4.34 million voted yes, 74.17% of votes cast, but that fell short of the threshold of a quarter of eligible voters (about 5 million), so public opinion on nuclear power remains unsettled.
Compared with 278.6 Mt CO₂e(2023 (2025 inventory))
Net of carbon sinks, 251.4 Mt, 6.59% below the 2005 baseline; manufacturing is half of the total. Each year's inventory revises earlier years.
Why it matters Taiwan has written net zero by 2050 into law, and this is the ruler for progress. Manufacturing produces half of emissions, so the tug-of-war between chip expansion and decarbonisation shows up here.
2.197 million hectares of forest, of which 415,000 hectares grow outside designated forest land.
Why it matters Six-tenths of the land is forest, which holds water, steadies slopes and shelters wildlife. Plenty of forest does not mean plenty of timber: Taiwan supplies only 0.5% of the wood chips its paper industry uses.
9,881 of them, about 15%, are endemic. This is a live count from the catalogue database, including introduced species, and changes as it is updated.
Why it matters Nearly 10,000 endemic species live nowhere but Taiwan. If they disappear here they disappear from Earth, and only Taiwan can protect them.
Up 89.5% in a year, with computers and peripherals alone adding US$98.7 billion; together with electronic components it makes up 74% of all exports.
Why it matters This is the share of the AI boom that lands in Taiwan: computers and related units sold US$98.65 billion more in a single year. The faster and more concentrated the growth, the larger the adjustment when the boom cools.
Up 22.7%, with manufacturing about two-thirds of it. This is ITRI's estimate, revised upward several times this year.
Why it matters The suppliers and engineers around the Hsinchu, Taichung and Tainan science parks all depend on this industry. With output up 22.7% in a year, demand for power, water and engineers grows with it.
National R&D spending passed NT$1 trillion for the first time (NT$1.0493 trillion), 85.8% of it from the private sector.
Why it matters National R&D spending passed NT$1 trillion for the first time, 85.8% of it from the private sector. Company money mostly goes into company products; how much reaches basic research and other industries depends on the government's smaller share.
After several years stuck around 87%, it passed 90% for the first time; 93.4% of households are connected.
Why it matters With nine in ten people online, government services, bills, tax filing and hospital bookings keep moving online. The tenth not yet online is most easily left behind as more services go online-only.
Above half for the first time; the base is people who use the internet, not the whole population.
Why it matters More than half of internet users pay by phone, yet cash has not gone away: 25% of adults use only cash, and 76.1% of street vendors accept only cash. The switch is slowest in night markets and traditional markets.
23.96 million people insured, above 99% every year since 2010.
Why it matters Almost everyone is covered, so nobody has to ask about insurance before seeing a doctor: the plainest result of the scheme since it began on 1 March 1995. How to pay for care as the population ages is the next question.
35 per 10,000 including Chinese medicine practitioners and dentists; 84.1 nurses per 10,000.
Why it matters 24.2 Western-medicine doctors per 10,000 people is nearly 30% more than ten years ago. What the average hides is distribution: doctors cluster in cities and some specialties, and gaps in rural and acute care only show up county by county and specialty by specialty.
27.5% of all deaths and the leading cause for 44 years running; lung, liver and colorectal cancer have been the top three for 22 years.
Why it matters Cancer has been the leading cause of death for 44 years, and the older the population, the more people get it, so this number is hard to bring down. How widely screening reaches decides how many cases are caught while they can still be treated.
About 225,000 trips a day, with 71.59% of seats filled.
Why it matters High-speed rail cut Taipei to Kaohsiung to about an hour and a half, making same-day trips between western cities ordinary. All 12 stations are in the west; the east and the outlying islands are not on the network.
770 million trips a year, up 3.7%; Taipei Main Station alone sees 300,000 entries and exits a day.
Why it matters With 2.1 million trips a day, Taipei is one of the few places in Taiwan where you can live without a scooter or car. Nationally, households without a vehicle make 53.3% of their trips by public transport, against 13.7% for households with one.
19.55 million eligible voters, 14.05 million of whom voted.
Why it matters Voting is not compulsory in Taiwan, so turnout reflects voters' own choice to go to the polls. The higher it is, the broader the winner's mandate; 66.27% in 2016 was the lowest of eight elections.
73 constituency seats, 34 party-list seats and 6 Indigenous seats; party-list seats are shared out by party vote.
Why it matters The 113 seats decide which bills and budgets pass. Since 2024 no party has held a majority, so legislation needs votes from across party lines.
Rated Free: political rights 38/40, civil liberties 55/60.
Why it matters The score measures protections for elections, speech, assembly and the courts. Taiwan reached 93 within about three decades of the end of martial law, starting from one-party authoritarian rule.
The score fell from 77.04 to 75.44, a drop of four places.
Why it matters Reporters Without Borders scores five areas: political, economic, legal, social and security. Falling four places in a year means journalists' working conditions were judged to have worsened. Elections and public debate rest on whether journalists can report freely.
Includes the main island of Taiwan plus Penghu, Kinmen, Matsu, Dongsha and other outlying islands.
Why it matters Mountains, hills and terraces make up nearly 70% of the main island; plains and basins only 31%. The six special municipalities hold 69.87% of the population on 30.12% of the land.
The highest peak in East Asia: an island of some 36,000 km² that climbs from sea level to almost 4,000 metres.
Why it matters From sea level to nearly 4,000 metres, Taiwan spans climates from tropical to alpine. High mountains also make rivers short and fast: in heavy rain the water comes quickly, and in a drought it cannot be held.
Two and a half times the world average, but it falls mostly in the plum-rain and typhoon seasons on short, steep rivers, so little of it stays.
Why it matters Rainfall is more than double the world average, yet Taiwan often runs short because the rain comes in the plum-rain and typhoon seasons and short, fast rivers cannot hold it. In a drought, farms, industry and households have to be put in order of priority.
A high of 348 in 2022 and 2023, then five fewer in 2024.
Why it matters Museums and local culture halls hold each place's artefacts, old photographs and industrial records; when one closes, its collection has to find another home. There were five fewer in 2024 than the year before.
78.5% Taoist and 19.3% Buddhist, alongside 3,280 churches. This is the latest year the ministry has published; check its religion portal for current figures.
Why it matters More than 12,000 registered temples are nodes of local life: festivals, processions, campaign stops and community affairs often happen in front of a temple.
2025's 41.8 kg is the lowest on record, nearly 7 kg less than twenty years earlier. The ministry cites food delivery, which means less home cooking, as one reason.
Why it matters With less rice eaten, Taiwan now grows more than it needs: rice self-sufficiency was 107.3% in 2025. Whether paddy fields keep growing rice or switch crops depends on whether the rice still sells.
Almost the same as cereals (87.6 kg) and twice the rice; vegetables (108.8 kg) and fruit (104.3 kg) top the list.
Why it matters At 86.8 kg per person a year, meat now matches grains by weight and is twice the amount of white rice. The table has a new centrepiece, and only about 30% of the calories Taiwan eats are produced at home.
Below 40% since 1992 and around 30% for two decades. Rice alone is 107.3% self-sufficient; the whole shortfall lies in crops other than rice.
Why it matters Seventy percent of the calories Taiwan eats are imported; if shipping is cut off, everyday meals are affected. That is why food self-sufficiency and strategic reserves are discussed as national security.
Declared on 19 May 1949 and in force from the 20th until it was lifted on 15 July 1987; nine years later Taiwan held its first direct presidential election.
Why it matters During 38 years of martial law, military courts tried 29,407 criminal cases against civilians. Within five years of its end, the newspaper ban, the Period of Mobilization and the never-re-elected legislature were all gone, and transitional justice and the opening of political archives could begin.
Plus 1,786 historic buildings, 79 cultural landscapes and 58 archaeological sites, counting entries registered in the heritage database.
Why it matters Once listed, a monument cannot be demolished or altered without review. These 1,063 monuments and 1,786 historic buildings are the old structures and sites the law protects from being torn down at will.
It jumped above 20% in 2020 and 2021, the years the pandemic halted Hollywood releases; total admissions in 2024 were 23.4 million.
Why it matters How much of the local box office Taiwanese films take affects whether they can recoup their costs and fund the next one. When Hollywood releases stopped in 2020 and 2021 the share passed 20%; in a normal year it is around 10%.
Download the full table with sources, periods and raw-data links: CSV
·
JSON
One country, four different names across the world’s databases
In international databases, Taiwan is often not called Taiwan, or not there at all
We checked 22 widely cited international databases one by one: 7 list it as Taiwan, 6 use a name containing "Province of China", 4 use Chinese Taipei or Taiwan, China, and 5 have no Taiwan at all. The WHO, UNESCO, the UNDP Human Development Report and the World Bank are all in that last group, so for health, education and human development figures the only source for Taiwan is Taiwan’s own official statistics.
How international databases label Taiwan (verified October 2026)
None of its 296 economies is Taiwan; the China series is footnoted as excluding "Taiwan, China", and the Bank refers readers to Taiwan's own government sites
Where international rankings leave Taiwan out, Taiwan runs the formula itself
The UNDP's Human Development Index and Gender Inequality Index do not include Taiwan, so Taiwan's statistics office and the Executive Yuan's Department of Gender Equality apply the same published formulas to Taiwan's data and slot the result into the original rankings. These are not the publishing bodies' own rankings, but the method is public and can be checked.
How this page handles names: The page always says Taiwan. Each database’s own label is copied verbatim into its own column, untranslated, so readers can check it themselves. Where a database has no Taiwan we say so, rather than filling in a zero or leaving a blank, and figures from different sources are never stitched into one time series.
Every data chart on this site is titled with a finding
76 articles on this site carry 150 data charts; jump from here to the paragraph each one belongs to
This index is built automatically from every article on the site, so it grows whenever an article gains a chart. A few are drawn below; the rest are listed by topic, and each title links straight to its paragraph.
Downstream business list: grew from 257 to 1,322 shops in eleven days
Downstream business list: grew from 257 to 1,322 shops in eleven days
Publication date
Number of shops
7/5
257
7/6
360
7/15
1006
7/16
1322
Source: FDA press releases (7/5, 7/6), Health Foresight and Central News Agency (7/15, 7/16)
If you need raw data, start by knowing where each kind lives
Taiwan's raw data is spread over dozens of platforms; here they are, sorted by what each is good for
Official statistics, local governments, civic tech, data journalism, academic archives and international databases each have their strengths. Every entry says what it is good for, its formats and access, and the snags you will hit in practice.
Official statistics and open data
The national open-data portal is a catalogue; most statistics actually live on each ministry's own site. To look up a number, start with the agency that publishes it.
The national catalogue: 52,556 datasets as of 23 Oct 2026, and the whole list can be downloaded as CSV.
CSV
JSON
catalogue download
Many datasets are the same table split by year; strip the ROC year from titles and only about 43,500 distinct ones remain, so you assemble the time series yourself.
Both publish a downloadable inventory of every dataset, the easiest to integrate programmatically.
inventory CSV
Civic tech and independent databases
Civil society picks up what government leaves undone: turning data into APIs, keeping history for feeds that only show the present, and breaking budget reviews into individual line items.
Who proposed each budget cut or freeze and why, down to the line item; code and data are open. Taiwan.md's Budget Decade covers the long-term trend, so the two complement each other.
Over a million collection items that registered users can curate into exhibitions.
collections
International databases that include Taiwan
Before comparing internationally, check that a database has a Taiwan row at all. These do; for how each one names Taiwan, see the international databases section above.
A securities and macro database with over 30 years of history, widely used in academic research.
institutional licence
Common snags with Taiwanese data
ROC calendar years About three in ten dataset titles carry ROC years: "114" in a field means 2025. A single API can mix ROC and Gregorian dates.
Big5 encoding About one dataset in ten is still a Big5-encoded CSV, which turns to gibberish if opened as UTF-8; convert it first.
PDF-only releases 1,187 datasets exist only as PDFs, and monthly bulletins often are too, so they have to be parsed before use.
Mean versus median Average wages are pulled up by high earners; the median is the line half of workers fall below. Job-site salary surveys use a different basis from official statistics and cannot be compared directly.
One number, several versions International aggregators disagree on Taiwan's population by over a hundred thousand because they use different years and estimates. Use the Taiwanese agency that publishes the figure, and state the period.
Official data can disappear Government sites often show only the present and can withdraw data in bulk (in August 2026 the CDC pulled 234 case-statistics datasets at once). Record the date and URL of anything you use.
Attribution is mandatory Taiwan's open government data licence allows commercial use and is compatible with CC BY 4.0, but reuse without naming the original agency counts as never having been licensed.
International databases may lack Taiwan The World Bank, WHO, UNESCO and UNDP have no Taiwan row. When comparing with them, fill Taiwan's cell from Taiwan's official statistics and note the different source.
For people who code, research, or want AI to understand Taiwan
The numbers on this page can be downloaded, queried in code, and read by AI under Taiwan’s own name
Everything on this page is plain text and tables in the HTML source, so search engines and AI crawlers can read it without running scripts. These machine interfaces are also available:
Indicator downloads (CSV / JSON)
Every indicator on this page: value, period, type, source URL and raw-data link, with Chinese and English fields. https://taiwan.md/data/taiwan-indicators.csv
https://taiwan.md/data/taiwan-indicators.json
Article API
Titles, descriptions, categories and URLs of every article, as static JSON with no key required. https://taiwan.md/api/articles.json
https://taiwan.md/api/stats.json
MCP server
Lets AI assistants such as Claude search and cite Taiwan.md directly. npx -y taiwanmd mcp install --client claude-code npx mcp-remote
https://mcp.taiwan.mdSetup guide
llms.txt and raw Markdown
A site description written for language models, and the raw Markdown of every article. https://taiwan.md/llms.txt https://taiwan.md/raw/economy/{slug}.md
Source code and data
The whole site, its data files and the scripts that produce these numbers are on GitHub, ready to fork. https://github.com/frank890417/taiwan-md
Cite this pageTaiwan.md (2026-10-23). Data Taiwan: key indicators and data sources for Taiwan. https://taiwan.md/en/data/ , licensed CC BY-SA 4.0. The original source of each figure is the institution named on its card.
One wrong number and the whole page loses its credibility
How we choose numbers, check them, and keep them current
How we choose
We pick numbers that answer "how is Taiwan doing now": at least one per topic, preferring indicators with long series, regular official releases, and an article on this site to read next.
How we check
Every value is checked against the publishing body’s own page or statistical table, with the original wording, period and URL recorded. Press releases are only leads. Industry estimates and international rankings are labelled separately from official statistics.
How we keep it current
The last full verification of this page was on October 22, 2026. Each indicator records how often its source publishes, and a script flags any number that is overdue so it goes on the update list.
How we name Taiwan
This page always says Taiwan. When we cite an international database we copy its label verbatim in a separate column, endorsing no particular name, and we do not refuse a database’s numbers because of what it calls Taiwan.
Spotted a mistake?
If a number is wrong, a source is out of date or a link is broken, use the feedback button at the bottom right, or open an issue: GitHub Issues