Start driving from Xinyi District in Taipei, head south and then east, and finally arrive in downtown Taitung. The navigation shows a little more than 300 kilometers, a trip of less than a day. But if you shift your eyes to another scale, how many people live in each square kilometer outside the window, that journey feels like crossing two countries. Taipei City, where Xinyi District is located, packs 8,975 people into each square kilometer; Taitung County, where Taitung City is located, has only 59 people per square kilometer. The same Taiwan, the same passport, and a full 151-fold difference in density.
This figure is not a trick produced by extreme values. It is a real disparity within Taiwan. We are used to talking about “Taiwan” as a whole, its economy, its elections, its low birthrate, but once you lay out the full county and city data from the Department of Household Registration at the end of 2025, you find that there is no homogeneous Taiwan at all. Some people are packed into concrete forests waiting in lines at traffic lights; others can drive for ten minutes without seeing a second car. Some counties and cities are still growing; most are shrinking. Between the youngest corner and the oldest corner lies a gap of nearly one generation.
This article sets out to do one thing: use official data to draw a scaled, verifiable portrait of the whole country. Once the portrait is complete, you will see a face that is sharply divided and aging rapidly. 1
30-second overview: At the end of 2025, Taiwan’s total population was 23,299,132, about 23.30 million, and had declined for 23 consecutive months. The number of newborns fell below 110,000 for the first time. In the same year, Taiwan formally entered “super-aged society” status, with one in every five people over age 65. But the national average conceals enormous internal disparities: the counties and cities with the highest and lowest population densities differ by 151 times, their population sizes differ by 297 times, and their degree of aging differs by nearly one generation. People are concentrating in the six special municipalities; the leading edge of aging is not in the cities but in eastern Taiwan, outlying islands, and agricultural counties; and the youngest places are Hsinchu County and Hsinchu City, sustained by the Hsinchu Science Park. This is a Taiwan that is divided, and aging together. 2
Seventy Percent of the People, Thirty Percent of the Land
Begin with a fact that is easy to overlook: people in Taiwan actually live in a highly concentrated pattern.
At the end of 2025, the six special municipalities, Taipei, New Taipei, Taoyuan, Taichung, Tainan, and Kaohsiung, had a combined population of 16,278,931, accounting for 69.87% of Taiwan’s total population. In other words, nearly seven in every ten people in Taiwan live in the six special municipalities. Yet the land area of those six municipalities combined accounts for only 30.12% of Taiwan’s total area. Seventy percent of the people are crowded onto 30% of the land; the remaining 30% are spread across the other 70% of the land. This is the first structure in Taiwan’s population distribution.
This seven-to-three pattern did not form naturally. It has a clear institutional starting point. On December 25, 2010, Taiwan rewrote its administrative map in one stroke: Taipei County was upgraded into New Taipei City; Taichung County and City merged, as did Tainan County and City and Kaohsiung County and City; together with the original Taipei City, five special municipalities were born at the same time. Four years later, on December 25, 2014, Taoyuan was upgraded into the sixth special municipality. In just four years, Taiwan went from two special municipalities to six, and the balance of resources, budgets, and infrastructure tilted accordingly. 3
An upgrade has never been just a name change. Special municipalities receive much higher centrally allocated tax revenues, staffing quotas, and autonomous fiscal resources than ordinary counties and cities. Where infrastructure goes, job opportunities grow; where jobs grow, young people move. The institution drew a line first, and the population then flowed along that line. The concentration in the six special municipalities we see today is, in some sense, the fruit borne more than a decade after the 2010 restructuring.
The following chart breaks down more clearly “where people in Taiwan live.” New Taipei City alone contains 17.4% of the national population, followed by Taichung at 12.3%, Kaohsiung at 11.7%, Taipei at 10.5%, Taoyuan at 10.1%, and Tainan at 7.9%. Together, the six special municipalities approach 70%. The other 16 counties and cities scattered across Taiwan, from northern Taiwan all the way to the outlying islands, add up to only 30.1%.
Source: Department of Household Registration, end of 2025
Stare at this grid chart a little longer, and one question emerges: what kind of life is being lived by the 30% of people scattered across 70% of the land? The answer is hidden in density.
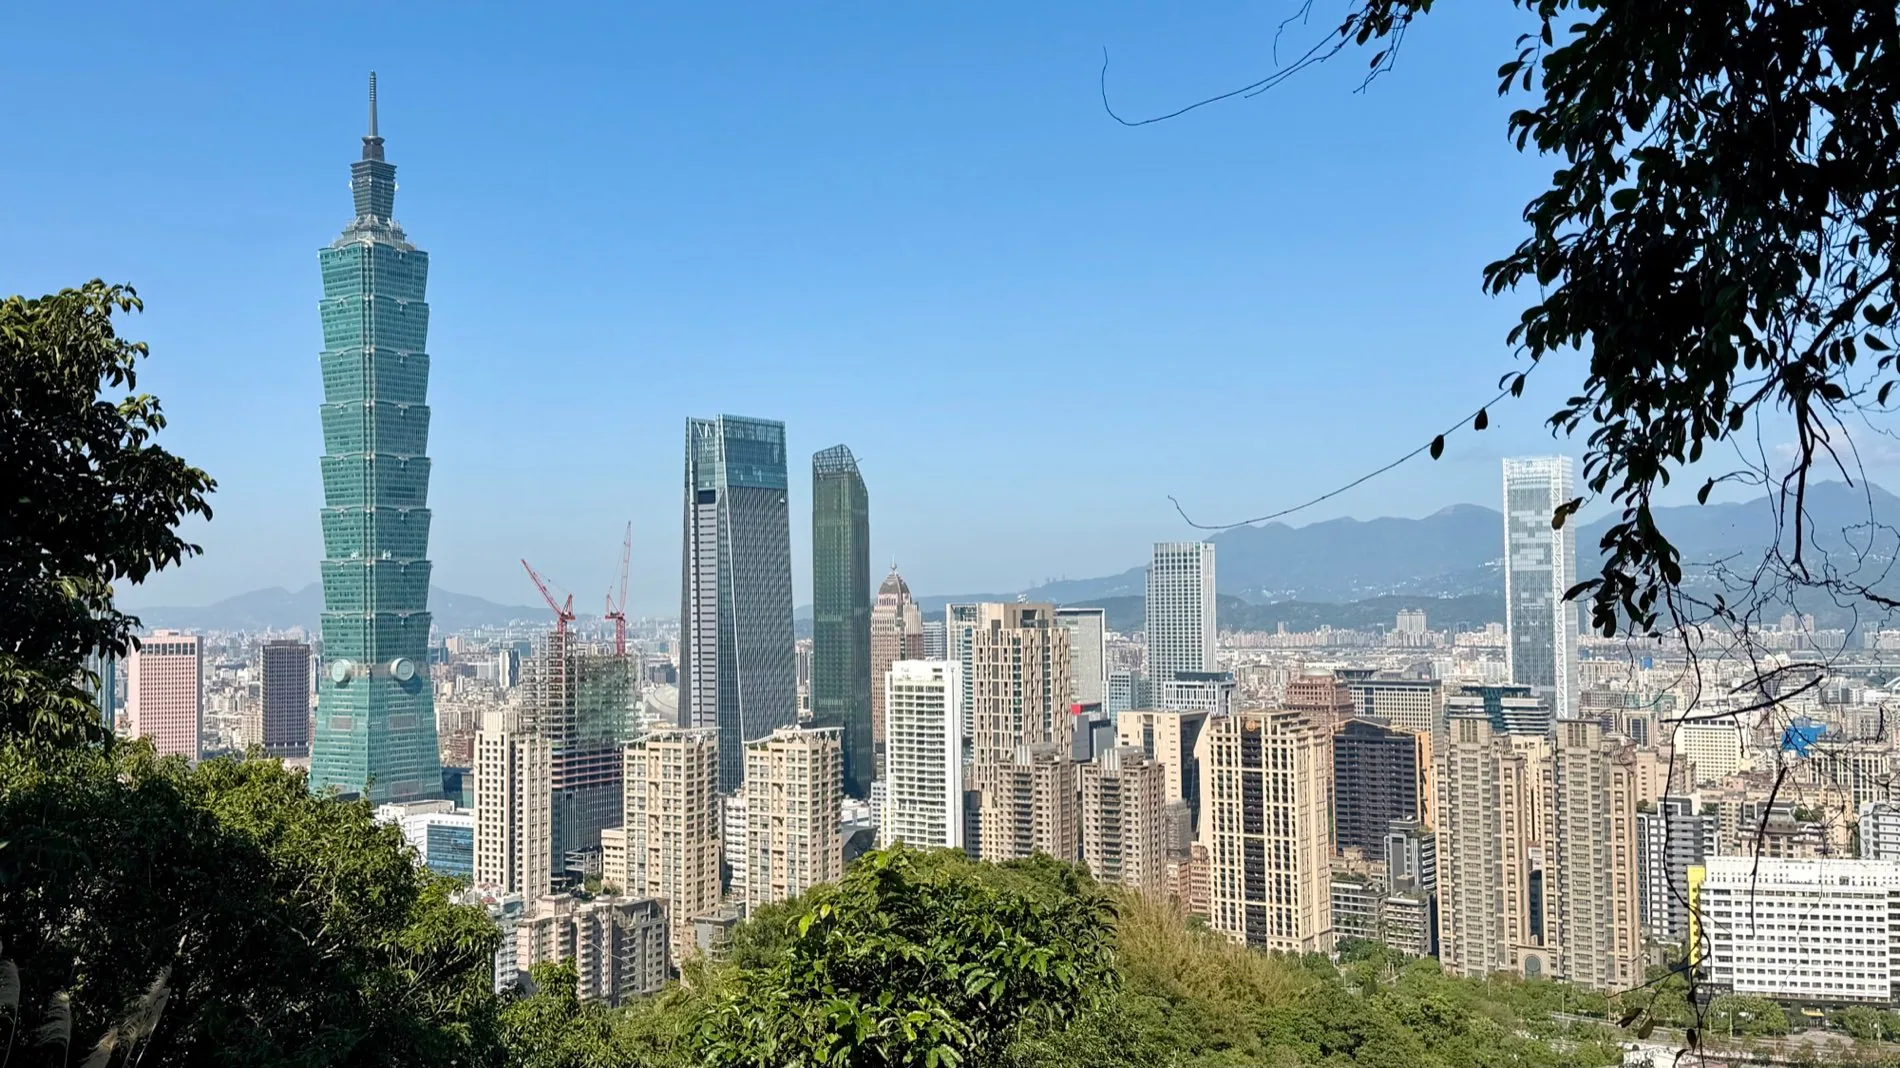
Taipei City’s skyline. Taiwan’s most crowded county or city packs 8,975 people into each square kilometer. Photo: Heeheemalu, CC BY-SA 4.0 via Wikimedia Commons.
From the Most Crowded to the Most Empty, a 151-Fold Difference
Population concentration is about “how many people.” Density is about “how crowded it is.” The latter gives a stronger sense of the distance between two Taiwans.
Taipei City has 8,975 people per square kilometer, making it the most crowded place in Taiwan. Taipei’s crowding is everyday life: the MRT is packed at rush hour, traffic lights can take two cycles to cross, and housing is built tall and narrow. Hsinchu City follows with 4,376 people per square kilometer, not even half of Taipei’s figure; next is Keelung City, with 2,710. Even among the three most crowded cities, density already falls off a cliff.
Source: Department of Household Registration, end of 2025
Shift your eyes to the other end of this bar chart, and the gap truly takes shape. Changhua County has 1,126 people per square kilometer, already relatively dense among agricultural counties. By Hualien County, the figure drops to 68. At the bottom, Taitung County has only 59 people per square kilometer. The number of people Taipei fits into one square kilometer would take 151 square kilometers to fit in Taitung. This is what the 151-fold gap really looks like: you drive from Xinyi District all the way to Taitung and watch the population thin out outside the window.
Behind this lies another geographical fact. Taiwan’s largest county or city by area is Hualien County, at 4,628 square kilometers, almost an entire eastern flank of the Central Mountain Range. Large land area, few people, and many mountains naturally dilute the density of Hualien and Taitung to Taiwan’s lowest levels. The smallest, Lienchiang County, is only 28.8 square kilometers. Density is half a matter of human choice and half determined in advance by terrain.
Common phrasing often treats “high population density” directly as progress and “low density” as backwardness, but that correspondence actually reverses cause and effect. Taitung’s density is low not because it cannot develop, but because it backs onto great mountains and faces the Pacific Ocean; its geographical conditions are inherently spacious and sparsely populated. Hualien’s “emptiness” contains Taroko, the Coastal Mountain Range, and Taiwan’s most complete eastern landscape. Density figures only tell you whether people are crowded. They do not tell you the value of that land. When all 22 counties and cities are arranged on a spectrum from crowded to empty, what you see is the different ways of living that have grown out of different terrain on the same Taiwan.

_Brown Boulevard in Chishang, Taitung. The emptiest county on the same Taiwan has 59 people per square kilometer, one one-hundred-fifty-first of Taipei’s density. Photo: Sinchen.Lin, CC BY 2.0 via Wikimedia Commons._
Giants and Specks of Dust
If density compares “how crowded,” population size compares “how large.” On this dimension, the gap is even more extreme than density.
Taiwan’s most populous jurisdiction is New Taipei City, with 4,044,831 people, a single city equivalent to many countries. The least populous is Lienchiang County, also known as Matsu, with only 13,621 people. New Taipei’s population is 297 times Lienchiang’s. Move everyone in Lienchiang County into New Taipei, and they would not even fill out a rounding error. Holding the same Republic of China passport, the “whole” of one county is only a speck of dust in the eyes of another.
This difference in scale turns directly into a governance problem. New Taipei has to handle transportation, housing, long-term care, and waste for four million people. Lienchiang has to think about how to keep an outlying island county of 13,000 people from continuing to lose population, how to maintain a hospital, and how to keep the last ferry running. The same law and the same set of central-government policies look completely different when applied across a 297-fold gap in population. When we talk about “local government,” the scale we imagine is often urban. But in Taiwan, quite a few counties and cities operate an entire government apparatus at the scale of a speck of dust.
But here we need to beware of an intuitive trap: small scale does not mean the population is young. You might assume that because young people leave outlying islands and small counties, leaving older people behind, such places are both small and old; you might also assume that because big cities have more resources and opportunities, they are both large and young. The real data overturns both assumptions. Lienchiang County has the smallest population, but its aging rate is 17.14%, lower than that of several large counties. Taipei City, Taiwan’s fourth most populous and most prosperous city, has the highest aging rate in Taiwan, 24.18%. There is simply no clean line connecting size and aging. To understand how Taiwan is aging, we need a different map.
The Leading Edge of Aging Is Not in the Cities
In 2025, Taiwan crossed a threshold: the national share of people aged 65 and above reached 20.06%, formally making it a “super-aged society” under the World Health Organization’s definition. In practical terms, 4.67 million people in Taiwan are over 65, meaning one in every five people is older. Among all 22 counties and cities, 14 have already passed an aging rate of 20%. Old age has become a shared ground color across the country.
But the national average of 20.06% flattens the intense internal differences. The table below lays out the aging rate and aging index for all 22 counties and cities. It is the one chart in this article most worth stopping over carefully. First, a note on how to read the “aging index”: it equals the population aged 65 and above divided by the population aged 0 to 14, multiplied by 100. A value of 100 means there are as many older people as children; the higher the number, the more “top-heavy” the place is, with more and more older people above and fewer and fewer children below.
| County/city | Aging rate 65+ (%) | Aging index |
|---|---|---|
| Taipei City | 24.18 | 202.06 |
| New Taipei City | 19.95 | 185.54 |
| Taoyuan City | 16.72 | 127.33 |
| Taichung City | 17.40 | 136.45 |
| Tainan City | 20.48 | 184.96 |
| Kaohsiung City | 20.79 | 192.10 |
| Keelung City | 22.28 | 240.21 |
| Hsinchu City | 16.16 | 106.59 |
| Chiayi City | 19.90 | 164.47 |
| Hsinchu County | 15.08 | 101.88 |
| Miaoli County | 20.23 | 179.56 |
| Changhua County | 20.37 | 178.35 |
| Nantou County | 22.66 | 224.64 |
| Yunlin County | 21.76 | 206.78 |
| Chiayi County | 24.11 | 291.69 |
| Pingtung County | 21.84 | 218.72 |
| Yilan County | 20.77 | 189.67 |
| Hualien County | 21.52 | 200.53 |
| Taitung County | 20.93 | 194.71 |
| Penghu County | 21.03 | 223.65 |
| Kinmen County | 19.69 | 255.57 |
| Lienchiang County | 17.14 | 180.23 |
Source: Department of Household Registration, end of 2025
When reading this table, pay special attention to the aging-index column. The highest in Taiwan is Chiayi County, at 291.69, meaning that in Chiayi County, every child corresponds to nearly three older people. Next are Kinmen County at 255.57 and Keelung City at 240.21. These three places share one feature: they are an agricultural county, an outlying island county, and an old port city shaped by industrial out-migration. None belongs on the list of Taiwan’s most prosperous cities. The deepest leading edge of aging falls in these corners that have long faced youth out-migration. When young people leave for work or school, those who remain slowly age, and newborns fail to make up the gap; the aging index then surges upward.
So where is Taiwan’s youngest corner? The answer may surprise many people: not in some untouched haven, but next to technology factories. Hsinchu County’s aging rate is only 15.08%, the lowest in Taiwan; its aging index is 101.88, almost a one-to-one balance between older people and children, a striking outlier in a country otherwise marked by aging. Hsinchu City, at 16.16%, and Taoyuan City, at 16.72%, follow close behind. The youthfulness of these three places almost all points to the same cause: the Hsinchu Science Park. The semiconductor and technology industries draw in large numbers of engineers and technical workers of childbearing age. They form families and have children here, pulling the population structure of these counties and cities toward the younger end. What the Hsinchu Science Park supports is not only Taiwan’s export figures, but also the youngest part of Taiwan’s demographic map.
Put the youngest and oldest ends together, and the gap becomes even more glaring.
Source: Department of Household Registration, end of 2025
Hsinchu County’s 15.08% versus Chiayi County’s 24.11% is a nine-percentage-point gap in aging rate; their aging indexes, 101.88 versus 291.69, differ by nearly three times. One is still growing, with people flowing in; the other continues to lose population, with people moving out. Between these two counties on the same Taiwan, the degree of aging differs by nearly one generation. In a park in Hsinchu, you may see young parents pushing strollers; in a Chiayi village, an entire street may be filled with older residents walking slowly. Both Taiwans are calculated from the Department of Household Registration’s numbers.
Here, we need to dispel a popular misunderstanding: many people think aging is the preserve of the countryside and outlying islands, and that large cities should be immune because they have many young people and many opportunities. The data says there is no such thing. Taipei City’s aging rate is 24.18%, the highest in Taiwan; its aging index is 202.06, also the highest among the six special municipalities. Taiwan’s most prosperous and resource-rich city is also the oldest of the six. The reason is not hard to understand: Taipei’s housing prices are high, pushing young families to New Taipei and Taoyuan to form families and raise children, while the people left in the city are the generations who settled there earlier and are now gradually growing old. Urban prosperity cannot stop aging. It only ages in a different way. Aging is not an illness of certain counties and cities; it is the shared condition of the whole country, only unfolding at different speeds and in different sequences.
One Taiwan, Aging Together
Pull the lens back from counties and cities to the national level, and Taiwan’s aging story has another, more alarming dimension: speed.
Taiwan did not begin aging only now. In 1993, the national share of people aged 65 and above exceeded 7%, entering an “aging society” by international definitions. In 2018, this figure reached 14.05%, making Taiwan an “aged society.” In 2025, it passed 20%, making Taiwan a “super-aged society.” These three milestones look like just three years, but what lies inside them is a downhill slope that keeps getting faster.
Look at the two intervals on this timeline. Taiwan took 25 years to move from 7% to 14%, but only seven years to move from 14% to 20%. The latter stretch took less than one-third the time of the former. Taiwan is aging, and aging faster and faster. This is rapid by international standards. Other countries had decades to slowly adjust their long-term care, pension, and medical systems. Taiwan has been compressed into just seven years and must build an entire system of elder care within a very short window.
| Year | 65+ share |
|---|---|
| 2000 | 8.6 |
| 2010 | 10.7 |
| 2020 | 16.1 |
| 2025 | 20.06 |
Source: Ministry of the Interior, National Development Council
This rising line makes the acceleration clearer. In 2000, the national share of people aged 65 and above was 8.6%; in 2010, it was 10.7%, a rise of only a little more than two percentage points over ten years. But from 2010 to 2020, the figure surged from 10.7% to 16.1%, and then to 20.06% in 2025. The tail of the line is visibly steeper than the head. Taiwan’s aging curve is bending upward.
The other side of aging is the collapse at the birth end. In 2025, the number of newborns in Taiwan fell below 110,000 for the first time, to only 107,812. Low birthrate and aging are two sides of the same coin: more and more older people above, fewer and fewer children entering below, and the entire population structure becomes increasingly top-heavy. This is also why the aging indexes of the counties and cities above are so high: older people above increase, while children below become far too few.
📝 Curator’s Note
We easily understand “population decline” as “young people moving from the countryside to the cities, so the countryside shrinks and the cities grow,” as if it were only a relocation within Taiwan. But the 2025 data reveals something more fundamental: every county and city in Taiwan has negative “natural increase.” That is, in every county and city in Taiwan, regardless of urban or rural, large or small, deaths exceed births. This is no longer a question of where people are flowing; the entire country is already seeing more people die than be born. In-migration and out-migration merely redistribute a population that is already shrinking. They do not create any new people.
This fact is worth pausing over. In 2025, only four counties and cities in Taiwan were still growing: Taoyuan, Hsinchu County, Taichung, and Hsinchu City. Moreover, all of their growth came from “social increase,” meaning the in-migration of people from elsewhere. They relied on drawing people from other counties and cities, not on births of their own. Apart from these four, the other 18 counties and cities all lost population. The largest declines were in Kinmen County, Lienchiang County, and Taipei City; note that even the most prosperous Taipei City is on this list of places losing population. When births in every corner of the country fail to offset deaths, the four counties and cities that are still growing are in fact only temporarily standing on other places’ losses.
This is why the total population declined for 23 consecutive months, falling to 23,299,132. It is a synchronous contraction across the whole country, with every county and city shrinking. The only difference is that some places can temporarily sustain appearances through in-migration, while others lack even that buffer.
The Portrait Drawn by Data
Return to the journey at the beginning. From Xinyi District in Taipei to Taitung, the number of people per square kilometer falls from 8,975 to 59, as if crossing two countries. Now you know that this is not only a density gap. Along the way, population size shifts from giant to speck of dust, aging slides from the youthfulness supported by the Hsinchu Science Park toward the aging leading edge of agricultural counties, and the one thing that does not change is that wherever you stop, local deaths already exceed births.
This is Taiwan’s portrait in 2025: a face that is highly divided and aging together. Its internal disparities are astonishingly large, with density differing by 151 times, scale by 297 times, and aging by nearly one generation. Yet the fundamental condition it faces is strikingly consistent: across the whole country, more people are dying than being born; the total population has shrunk for 23 consecutive months; and in just seven years, Taiwan rushed from an aged society into a super-aged society. The National Development Council’s projection says that under the medium projection, Taiwan’s total population will fall to 14.97 million by 2070, the share aged 65 and above will reach 46.5%, and the demographic dividend will end in 2028. This portrait will not improve on its own. 4
Recognizing that Taiwan is so internally uneven is necessary for seeing the country’s real challenge clearly: a place with such large internal differences must use one set of policies to care simultaneously for four million people crowded in a basin and 13,000 people holding on in an outlying island county, while facing both the youngest Hsinchu and the oldest Chiayi. Taiwan is divided, but it must act as a whole; it is aging, but it must find a way forward together. Data has drawn this face for us. How to respond to this face is the question the whole country must answer together.
Further Reading
- Taipei City — Taiwan’s most crowded city, with 8,975 people per square kilometer, and also the oldest of the six special municipalities, with an aging index of 202; the same protagonist at both ends of this article’s density and aging story.
- Taitung County — The emptiest end of Taiwan, with 59 people per square kilometer, where two outlying islands bear the cost of an entire country.
- Chiayi County — With an aging index of 291.69, the highest in Taiwan, each child corresponds to nearly three older people; a representative of the aging leading edge among agricultural counties.
- Hsinchu County — With an aging rate of 15.08%, Taiwan’s youngest jurisdiction; the part of the map where the Hsinchu Science Park pulls the population structure toward the young end.
- Taiwan’s Low-Birthrate Crisis — The birth end of this portrait: newborns falling below 110,000, and the other side of a country where deaths outnumber births.
Image Sources
This article uses three images. The hero image is a NASA public-domain satellite image, cached under public/article-images/; the two inline images are Creative Commons-licensed images from Wikimedia Commons, each with attribution:
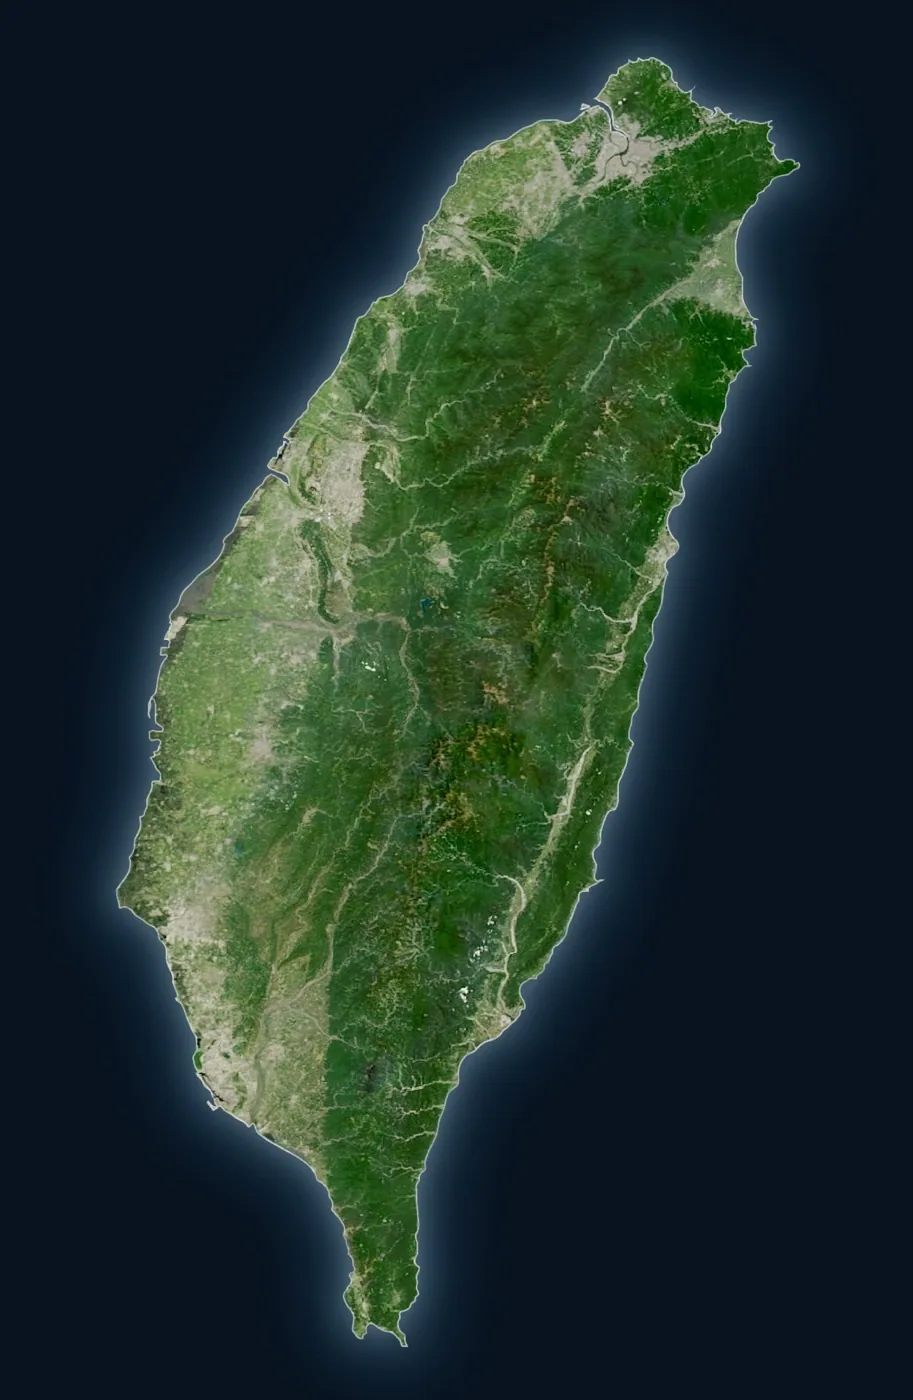
- Satellite image of Taiwan’s main island (NASA 2020 mosaic) (hero) — NASA, Public domain.
- Taipei City skyline (most crowded section) — Photo: Heeheemalu, 2026, CC BY-SA 4.0.
- Brown Boulevard in Chishang, Taitung (most empty section) — Photo: Sinchen.Lin, 2016, CC BY 2.0.
References
- Department of Household Registration, population statistics, end of ROC year 114 / 2025-12-31, including county and city population, land area, population density, share of population aged 65 and above, and aging index. The summed population of the 22 counties and cities, 23,299,132, exactly matches the official total. https://www.ris.gov.tw/app/portal/346↩
- Central News Agency / Ministry of the Interior, “Taiwan formally enters a super-aged society,” 2026-01-09. The report states that at the end of 2025, the total population was 23,299,132; the share aged 65 and above was 20.06%, or 4.67 million people; Taipei City was highest at 24.18%; Hsinchu County was lowest at 15.08%; and Taiwan had 107,812 newborns in 2025. https://www.cna.com.tw/news/ahel/202601090098.aspx↩
- Ministry of the Interior, 2010 restructuring into five special municipalities, with Taipei County upgraded into New Taipei City and Taichung, Tainan, and Kaohsiung counties and cities merged, effective 2010-12-25; Central News Agency, “Taoyuan County to be reorganized as a special municipality and inaugurated on December 25,” 2014-12-15. https://www.cna.com.tw/news/firstnews/201412150027.aspx↩
- National Development Council, “Population Projections for the Republic of China (Taiwan), 2024–2070,” released 2024-10-17. Under the medium projection, Taiwan enters a super-aged society in 2025; the demographic dividend ends in 2028, when the working-age population falls below two-thirds of the total population; the total population falls to 14.97 million by 2070; and the share aged 65 and above reaches 46.5%. https://www.ndc.gov.tw/nc_27_38548↩