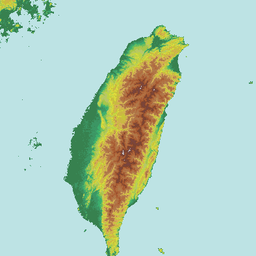
In August 2026, the Ministry of the Interior released the 114 (2025) Simplified Life Table: the average life expectancy for the population is 81.27 years, with females at 84.75 years and males at 77.93 years, an increase of 0.50 years compared to year 113 (2024). 12
In the same month, the Ministry of the Interior issued another press release titled "Excluding Malignant Tumors, Average Life Expectancy in Year 114 Could Increase by 3.70 Years." When these two figures are placed together, they form the core of this article: one life expectancy figure is a national average, but it is also an averaged-out figure. 3
I. A Post-Pandemic Recovery That Hasn't Reached the Starting Point
In year 114 (2025), the total number of deaths nationwide was 199,639, a decrease of 1,674 people compared to year 113, representing a decline of 0.83%. Of these, 151,936 deaths occurred among those aged 65 and older, accounting for 76.11%. The crude death rate was 8.55‰, which is 0.05 percentage points lower than the previous year. 1
After adjusting for the interference of population age structure, the standardized death rate was 395.3 per 100,000 people, a decrease of 15 people (3.7%) compared to year 113; this was also the primary reason for the rise in average life expectancy this year. 1
The cause of the recovery is the receding pandemic. Official statistics list COVID-19 deaths over the past three years: 8,962 in year 112 (2023), 2,962 in year 113 (2024), and 932 in year 114 (2025). 1 As deaths have decreased for three consecutive years, the life table has trended upward accordingly.
However, the magnitude of this recovery has not yet returned to pre-pandemic levels. Compared to year 109 (2020), when the pandemic began, the average life expectancy in year 114 is still 0.05 years lower; while female life expectancy is similar to year 109, male life expectancy is 0.18 years lower. 1 In other words, after six years, the national average has only taken half a step back to its original position.
II. Life Tables Do Not Calculate "How Long Everyone Lives on Average"
The core of a life table calculation is not "the average age everyone lives to," but rather the probability of death at every single year of age. The Ministry of the Interior uses annual deaths by age group, mid-year population counts, and monthly mortality data for newborns aged 0 to 6 months provided by the Ministry of Health and Welfare to estimate death probabilities, survival probabilities, and average remaining life expectancy for each age group. 1
"Zero-age life expectancy" is what the media often refers to as "average life expectancy." It means: assuming a newborn faces the current mortality risk of each age group every year moving forward, how old can they be expected to live? 1 This number describes the "mortality level of the current year," not "how long this specific group of people will actually live"—medical progress will cause actual lifespans to exceed this number.
Life tables also provide answers for other ages, which is where they are far more useful than a single "average life expectancy" figure:
| Age | Remaining Life | Meaning |
|---|---|---|
| 0 | 81.27 | The "average life expectancy" often cited by media |
| 20 | 61.87 | Can live another 61.87 years, totaling approx. 81.9 years |
| 40 | 42.56 | Mortality risks already passed are no longer counted |
| 60 | 24.89 | Totaling approx. 84.9 years |
| 80 | 10.16 | Totaling approx. 90.2 years |
Source: Ministry of the Interior "Summary Analysis of the 114 Simplified Life Table," Table 3 and age-specific remaining life sections
The facts revealed by this table are clearer than the headline figure: the longer you live, the longer your total expected remaining years become. An 80-year-old is expected to reach 90 because they have already survived the mortality risks of the previous eighty years. 1
III. A 6.82-Year Gap Between Men and Women
In year 114, female life expectancy was 84.75 years and male life expectancy was 77.93 years, a gap of 6.82 years, which is slightly narrower than the 6.88-year gap in year 113. 1
The gender distribution of deaths follows the same trend: in year 114, there were 114,793 male deaths (57.50%) and 84,846 female deaths (42.50%); the crude death rate for males was 9.99‰ and for females was 7.16‰. 1
This gap is not unique to Taiwan, but in Taiwan, the gap widens between different counties and cities. As shown below, the largest gender life expectancy gap in Taiwan is in Taitung County: 9.24 years.
IV. The Six Special Municipalities: A North-to-South Decline
Regarding the average life expectancy of the six special municipalities in year 114, official descriptions state that "regardless of total, female, or male populations, it generally shows a decrease from north to south." 1
| Municipality | Total | Male | Female |
|---|---|---|---|
| Taipei City | 83.98 | 81.10 | 86.74 |
| New Taipei City | 81.54 | 78.28 | 84.84 |
| Taichung City | 81.05 | 77.85 | 84.35 |
| Taoyuan City | 81.03 | 77.64 | 84.65 |
| Tainan City | 80.29 | 77.10 | 83.70 |
| Kaohsiung City | 79.80 | 76.48 | 83.25 |
Taipei City is the highest and Kaohsiung City is the lowest, with a difference of 4.18 years between them. There was also one small change this year: for the first time, the total and male average life expectancy in Taichung City surpassed that of Taoyuan City by 0.02 years and 0.21 years, respectively. 1
Compared to year 113, all six special municipalities saw an increase, with Taipei City seeing the largest increase at 0.58 years, followed by New Taipei City at 0.57 years. 1
V. Taitung's 9.24 Years
Among non-special municipalities, the highest average life expectancy in year 114 was Hsinchu City at 82.13 years (female 85.20, male 79.10), and the lowest was Taitung County at 76.49 years (female 81.54, male 72.30). 1
The gender gap in Taitung County is 9.24 years, the largest among all counties and cities in Taiwan. Eastern counties are generally lower than western ones; Taitung County and Hualien County are 4.78 years and 4.18 years below the national average, respectively. 1
Looking at a longer timeframe, the gap between Taitung County and the national average has narrowed by 0.20 years compared to ten years ago (year 104), while Hualien County's gap has widened by 0.63 years. 1 A change of 0.2 years in a single year may seem small, but this is the cumulative effect over a decade.
The largest increases were seen in Keelung City (+0.68 years) and Yilan County (+0.63 years). 1
Source: Ministry of the Interior "Summary Analysis of the 114 Simplified Life Table," Table 3
Two technical details must be clarified to avoid misinterpreting this chart. First, the average life expectancy for counties and cities is calculated using a combined population from years 112 to 114, rather than data from a single year, in order to reduce fluctuations in counties with smaller populations. 1 Second, Kinmen County was not calculated separately due to distortions caused by population migration, and Lienchiang County was not calculated separately because its population is too small. 1
VI. Placing Taiwan in the Global Context
According to the latest (2025) global average life expectancy released by the United Nations, females live to 76.2 years and males to 70.9 years; Taiwanese women live 8.6 years longer than the global average, and men live 7.0 years longer. 1
In Asia, Taiwan's life expectancy for both genders is lower than that of Japan, Singapore, and South Korea, but higher than that of mainland China, Malaysia, and Indonesia. 1 In the same year, Japanese females lived to 87.3 years and males to 81.4 years, while Taiwanese females lived to 84.75 years and males to 77.93 years—a difference of about 2.5 years for women and 3.5 years for men.
The international trend over the last decade follows a similar curve: average life expectancy in most countries rose generally before 2019, declined during the pandemic, and by 2025, many had returned to pre-pandemic levels. 1
VII. If One Specific Cause of Death Were Removed
In October, the Ministry of the Interior released a separate simulation: if malignant tumors (cancer) were excluded, the average life expectancy in year 114 could increase by 3.70 years. 3
This type of calculation is standard practice in public health; it means "if this cause of death disappeared, what would the average life expectancy become," and is used for discussions on resource allocation. It does not mean that any specific individual will live 3.7 years longer, nor does it mean that cancer has been solved. 3
Layering the figures from the previous sections, this life table truly tells us three things: the national average is recovering post-pandemic but hasn't reached year 109 levels; the regional gap between counties and cities remains fixed between 4 to 7 years in a "high in the north/Kaohsiung, low in the east" pattern; and the 6.82-year gender gap is amplified to 9.24 years in Taitung.
Life expectancy is a very useful indicator, but it is also an indicator that is easily mistaken for a final conclusion. Its annual fluctuations are only a fraction of a year, but behind them lie the death registrations of over 190,000 people, the population structures of 22 counties and cities, and a society that is still slowly recovering from a pandemic. 1
Further Reading:
- Viewing Taiwan's 22 Counties/Cities through Data — Other indicators under the same set of regional coordinates
- Taiwan's Declining Birthrate Crisis — The birth end and death end are two halves of the same population map
- Taiwan's Healthcare and National Health Insurance — The medical system behind the life expectancy curve
References
- Summary Analysis of the 114 Simplified Life Table (Statistics Division, Ministry of the Interior) — Official summary analysis stating 199,639 deaths in year 114, a crude death rate of 8.55‰, a standardized death rate of 395.3, average life expectancy of 81.27 (female 84.75, male 77.93), tables for the six special municipalities and various counties/cities, age-specific remaining life expectancy, ten-year trends, and international comparisons.↩234567891011121314151617181920212223
- Average Life Expectancy in Year 114 is 81.27 Years, an Increase of 0.50 Years from Last Year (Ministry of the Interior Press Release, 2026-08-24) — A press release from the Ministry of the Interior announcing the year 114 Simplified Life Table, with the headline stating the national average life expectancy and annual increase.↩
- Ministry of the Interior: Excluding Malignant Tumors, Average Life Expectancy in Year 114 Could Increase by 3.70 Years (Ministry of the Interior, 2026-10) — A simulation by the Ministry of the Interior categorized by cause of death, explaining that if malignant tumors were excluded, life expectancy could rise by 3.70 years; this is a counterfactual estimate rather than actual life expectancy.↩23