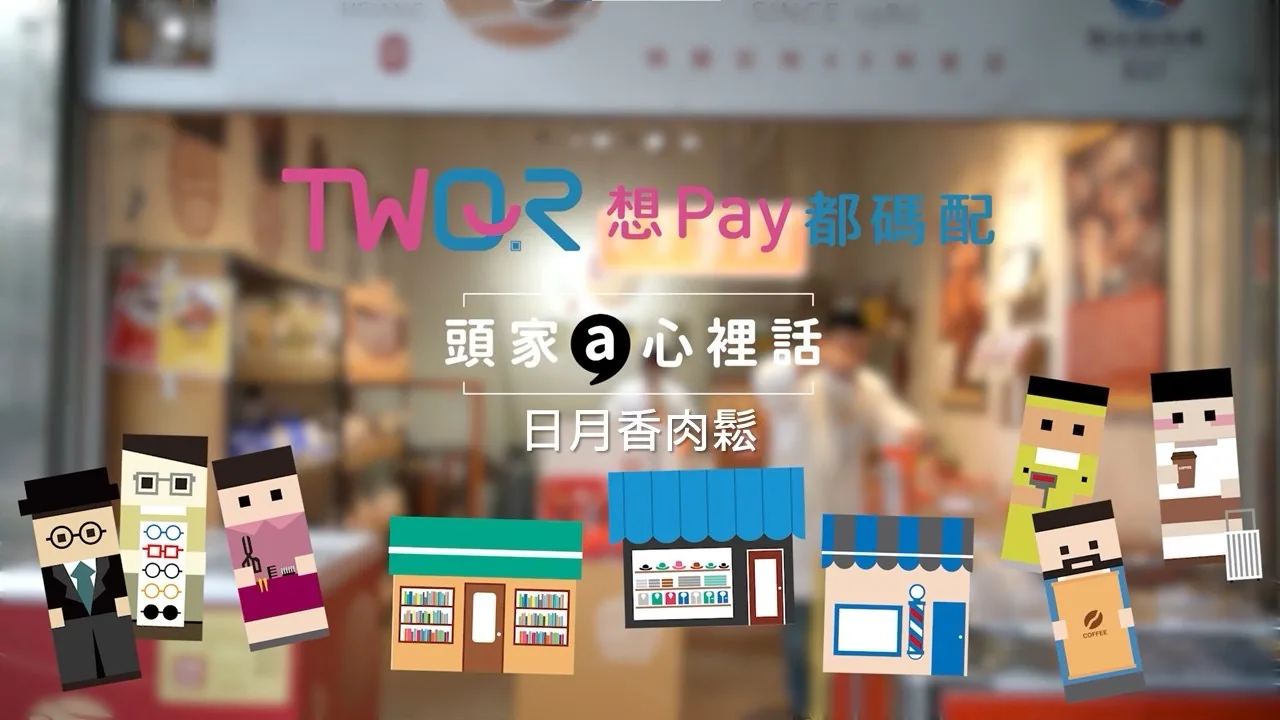
Official TWQR merchant interview thumbnail, used solely for institutional propaganda analysis. The image represents only the interviewed store and cannot serve as independent field evidence for adoption rates among small businesses across Taiwan. Image: Financial Information and Service Center (TWQR Official Website), used under fair use for commentary.
30-Second Overview: In Q3 2024, a MIC online sample showed 92% had used mobile payments. However, a survey commissioned by the central bank revealed that 73.8% of adults still use both cash and non-cash methods. These two figures measure different populations and questions, but together they point to the same reality: using a phone to pay, completing transactions everywhere, and feeling confident leaving cash at home are three distinct thresholds. Multiple apps sometimes fill channel gaps and sometimes chase rewards and membership features. TWQR is integrating a Common QR, but it has not yet synthesized all funding sources, merchant contracts, and failure scenarios into a single payment method.
In September 2025, Hu Zi-li (胡自立), Senior Industry Analyst at MIC, released a mobile payment consumer survey. He observed that active users install more than five tools, "mainly to be able to use mobile payments across different channels."1 This statement resembles an action many people perform at the checkout counter: first checking which logos are posted on the glass door or counter, then deciding which App to unlock. If no familiar logo is found, they look up and ask, "Which one do you accept here?"
The options in the phone are increasing, yet the wallet still holds several banknotes. This coexisting scene is easily interpreted as the Taiwanese payment market being too fragmented, or alternatively, as simply a matter of choosing rewards. Both explanations capture part of the truth. Institutional frictions in acceptance and interoperability indeed cause people to install more tools and retain cash, but rewards, memberships, transfers, habits, personal preferences, and backup for failures are also at play. To clarify this, we must first separate the three thresholds: whether individuals adopt the technology, whether transactions are universally usable across scenarios, and whether transactions can be restored to a point where users dare to leave their last banknote at home.
Having a Phone That Can Pay Doesn't Mean You Only Need It Today
The 92% "Have Used" and 84% "Frequently Use" figures from MIC come from a 5,000-response online sample collected over two months in Q3 2024. The public page does not fully list the sampling frame, age range, or weighting methods; therefore, these proportions can only describe that specific online sample and cannot be directly written as the adoption rate for the entire population of Taiwan.2 Even with this limitation, it still shows that in the consumer group filling out online surveys, mobile payment has long passed the stage of being unfamiliar technology.
Another survey conducted by the Taiwan Institute of Economic Research (TIER) under commission from the central bank asked how people aged 18 and above use cash and non-cash methods in their daily lives. The survey used landlines and mobile phones as primary methods, with online as secondary, covering 22 counties and cities, and weighted by demographic structure. The valid sample size was 4,234. The results showed that 73.8% used both cash and non-cash methods, 25% used only cash, and only 1.2% used only non-cash methods.3 Here, "non-cash" also includes credit cards, debit cards, and stored-value cards, so it cannot be used as a market share figure for mobile payments, but it is suitable for描绘ing the shape of today's wallet.
Source: Central Bank Commissioned Payment Tool Survey, published 2024
Therefore, a person using mobile sensing at a chain coffee shop in the morning, scanning codes for points at lunch, and switching to cash payment at a market in the evening is not contradictory. They have crossed the first threshold of "people using it," but still need to switch tools based on location, store, and equipment. The "still carry cash" in the title can only be understood as a large-scale scenario backup, not as a necessity for every Taiwanese every day.
Payment habits have changed, but scenario exceptions remain on the road. Installing a few more Apps seems to patch up exceptions one by one, but to understand why they can fill the gap, we must first admit that these Apps are not the same thing. The moment you open your phone looks similar, but the path the transaction takes afterward may be completely different.
Several Apps Look Like They Are Paying, But They Don't Walk the Same Path Underneath
The Financial Supervisory Commission (FSC) teaching materials list mobile credit cards, mobile debit cards, QR scanning, electronic payment institutions, and electronic tickets separately, based on binding tools, technology, and applicable regulations.4
The action consumers take at the front end might just be tapping, scanning, or pressing confirm once, but the backend might be completed by different binding tools, technologies, receiving ends, and rules. Paying on the same phone, some use bound cards, while others use electronic payment accounts. The receiving end and specifications connected by merchants further determine which combinations are usable. LINE Pay,街口 (Jiekou), Apple Pay, Fullpay (Quan Zhifu), and Taiwan Pay cannot simply be arranged as five homogeneous wallets based on their logos. Some compete with each other, some cooperate in layers within a single transaction, and some complement each other in different channels.
To see how platforms like PChome, Shopee, and KooChung (酷澎) change the online shopping scene, see the extended reading Taiwan E-commerce and Digital Payment Ecosystem. This article stops at the last mile of physical checkout.
Therefore, having a certain brand in your phone only answers whether the user has obtained the tool; it cannot directly answer whether the merchant has connected a compatible receiving end. Seeing the same QR code does not mean every App, scanning direction, and funding source can complete the transaction. Jumping directly from the phone icon to "usable across Taiwan" misses at least three layers in between: binding tools, merchant contracts, and transaction specifications.
The number of Apps also needs to rein in the exaggerated "average of five." MIC's 2024 online sample shows that 86% use five or fewer models, of which 61% use three or fewer, and 14% use six or more. Public data does not provide the mean or median, nor the complete distribution for one to five models.5 It supports multi-app coexistence but cannot shape a "typical user" who has exactly five installed.
The FSC's June 2026 monthly table sums the declared numbers of electronic payment institutions to 41.129 million. This is the sum of institutions, not the number of natural persons after cross-institution deduplication. It measures a contract snapshot and cannot answer how many tools a typical user has installed.6
📝 Curator's Note
The logos on the counter are brands, what is displayed in the phone is the interface, and what accumulates in the FSC tables are individual account contracts that have not yet been terminated. Calling these three the same "user count" flattens the most understandable layer of the payment market.
The front end looks similar, but differences emerge when the transaction reaches the other end. Users downloading more Apps cannot complete the application, confirmation, and reconciliation for the store. The second threshold lies behind the counter.
What Consumers See as One Scan, Merchants Must Connect as a Whole Process
For a store to accept Taiwan Pay, it must first apply to the acquiring financial institution to become a contracted merchant, obtain the acquiring bank code, merchant code, and terminal code, and then complete service registration.7 After starting to receive payments, the equipment and network must operate, the clerk must know how to confirm notifications and handle refunds, and the backend must complete reconciliation and disbursement. For small stores, posting the payment code is just the beginning; behind it lies an operational process that must be closed out daily.
The Taiwan Pay merchant FAQ writes specifically about the moment most easily obscured by a single QR code: when the device is offline, the merchant can still generate a QR code without an amount on the login page for the consumer to scan, but the merchant's phone will not receive the transaction push notification.8 The customer's screen shows payment completed, but the receiving end lacks the notification at that moment, forcing the counter to decide whether to release the goods and where to check this transaction. Scanning is just the starting point of the action; on-site confirmation and post-event accounting are what truly ground the transaction.
Taiwan Pay leaves the fee rate to the contract between the merchant and the acquiring bank; the official explanation states, "Transaction processing fees are determined by the contract between the merchant (payee) and the acquiring bank (bank)." Other platforms have public plans, chain merchants have negotiated prices, and different payment sources have their own conditions.9 Handling fees enter the merchant's judgment, but disbursement time, refunds, network, equipment, customer base, learning, and reconciliation also come into play.
Academic research on Tainan commercial district store owners even found that perceived usefulness, ease of use, consumer adoption, and compatibility are positively correlated with adoption intention, while perceived cost had no significant relationship in that sample.10 This also means merchants do not just bear costs; they also measure whether the tool is useful and whether customers have already adopted it. This local research cannot be extrapolated to the whole of Taiwan, but it is sufficient to prevent the single explanation that "merchants do not accept due to fee rates."
The central bank's commissioned survey gives magnitude to acceptance differences. Among 611 vendor samples, 76.1% only accept cash. Among 1,436 store samples, this proportion is 46.8%. The report links the higher proportion of vendors to venue, equipment, and scale.11 Here, "only accept cash" is relative to all non-cash tools and cannot be inverted into a mobile payment acceptance rate, nor used to criticize vendors for lacking the willingness to progress.
Source: Central Bank Commissioned Payment Tool Survey, published 2024
Payment universality must be completed by both ends: consumers have tools, and merchants also have processes for continuous payment, confirmation, refunds, and accounting. Institutional friction has taken shape here, but it still only explains part of the coexistence of multiple Apps and cash. The next App is sometimes a spare tire, and sometimes more like a membership card.
Installing Another App Is Sometimes for Usability, Sometimes Just for Better Experience
When the central bank survey asked about mobile payment difficulties, 18.9% selected "store does not accept," 12.0% selected "store does not accept my usual tool," and only 7.6% selected "too many types on the market." Poor network signal accounted for 6.5%, and phone running out of battery accounted for 3.4%.12 These are all multiple-choice self-reports and cannot be treated as causal proportions for cash transactions caused by each factor, but they show that there is indeed a gap between "having an App" and "this App in hand being usable."
The "different channels" mentioned by Hu Zi-li exactly correspond to this backup motivation. If a store does not accept the usual tool, the user might install another. Splitting bills with friends for a meal, or family members wanting to transfer points, might also leave another App behind. MIC's same series of surveys points out that 57% of users have used payment financial services other than consumption, with the most common being bill splitting and point gifting, accounting for 38%.13 These functions bring payment Apps into social and membership lives; the reasons for holding them have long exceeded whether the counter can scan.
A cross-four-region study commissioned by Visa in 2022 interviewed 1,000 Taiwanese respondents aged 18 to 55, of whom 40% regularly track consumption points, and 22% carefully calculate for optimal rewards.14 This data cannot estimate "how many people install more Apps for rewards," but only shows that some respondents track points and calculate discounts for rewards. Retail membership ecosystems also grow their own payment tools. To see how PX Mart has moved from store networks and membership management to high-frequency life platforms, see PX Mart; here we do not rewrite corporate history and controversies.
The Ministry of Economic Affairs' survey on the retail industry provides longer variations. Calculating payment amounts from the return table samples, the proportion of consumers using mobile payments rose from 0.6% in 2017 to 11.2% in 2023, while cash dropped from 41.1% to 23.0%. The official body attributes the changes in general merchandise retail and pharmacy industries partly to membership ecosystems and merchants' self-built payment tools.15 The proportion of mobile payments expanded, while the proportion of cash decreased during the same period. Multi-brand competition indeed creates choices. If we only diagnose multiple Apps as institutional failure, this upward trajectory and users' active preferences would be missed.
| 2017 | 2023 | |
|---|---|---|
| Mobile Payment | 0.6 | 11.2 |
| Cash | 41.1 | 23.0 |
Source: Ministry of Economic Affairs Statistics Bureau, Business Operations Survey of Wholesale, Retail, and Catering Industries
Multiple tools thus play two roles: one fills gaps in acceptance and funding sources, the other carries discounts, points, memberships, and transfers. The number of Apps itself cannot measure the distance to adoption, universality, or not carrying cash. After competition and backup are intertwined, the question falls on how far integration has gone.
TWQR Integrates Common QR, But Does Not Synthesize All Payments into One
TWQR is a substantive response to "too many payment specifications, too many merchant signboards." This Common QR standard connects participating financial institutions and electronic payment institutions. By the end of 2025, central bank data lists 44 financial institutions, 10 electronic payment institutions, and 678,000 contracted partner stores. Total transactions for 2025 were 146.73 million transactions, amounting to NT$713.6 billion.16 "Taiwan QR payments are completely non-interoperable" no longer fits the current situation.

TTWQR "One Contract, Multiple Payments" official institutional explanation material, presenting the merchant access method claimed by the Financial Information and Service Center. This is an institutional propaganda illustration and cannot independently prove that every partner store is active, every transaction is successful, or all payment sources are interconnected. Image: Financial Information and Service Center (TWQR Official Website), used under fair use for commentary.
The Common QR has solved an important layer, but the publicly available acquiring page of the Bank of Taiwan also shows that boundaries remain. The "Main Scan" list on that page lists 11 tools: Taiwan Pay, Jiekou, Fullpay, EasyWallet, iPass, etc. The "Be Scanned" list is shorter and limits QR Auth specifications. Fullpay, iCash, and Fullpay Pay appear in the Main Scan list but not in the Be Scanned list on that page.17 Scanning direction, specifications, and institution participation change usable combinations, and stores still must apply to the acquiring institution for TWQR.
678,000 is the number of contracted partner stores; this public data from the central bank does not provide how many stores are continuously active among them, nor the market share proportion or on-site success rate. The Common QR will not automatically unify funding sources like credit cards or accounts, membership points, rewards, store contracts, fee rates, and refund processes. It pushes signboards and transaction specifications toward a common layer, but does not flatten the commercial world of every App.
📝 Curator's Note
The most recognizable achievement of TWQR is hidden in the scope of the word "Common": Common QR and cross-institution messages have formed a large-scale base, but the daily activation of partner stores, each funding source, and each set of membership rules are still determined by other layers. Universality is being built layer by layer.
The interoperability threshold has moved forward, but the number of partner stores will not automatically become usable for everyone, every transaction, and every funding source. When integration engineering is still in progress, the retention of cash has another explanation.
Cash Does Not Prove Mobile Payment Failed; It Usually Doesn't Need to Ask First If It Can Be Used
For a tool to be universal, it must at least allow users to obtain it, allow merchants to identify and confirm it, allow transactions to complete, and also have a predictable recovery method when the phone is out of battery, the network is unstable, or notifications fail. This means both sides know where to query, when to retry, and which path to take after failure. After the transaction is completed, whether both sides can check the same record is also part of recovery.
By this ruler, mobile payment has shortened checkout times in a large number of daily consumptions, but still cannot provide the same path for every scenario. In most face-to-face small transactions, cash requires no registration, no device, and delivery and confirmation happen simultaneously, so it continues to serve as the lowest common interface. It also has change, custody, and inventory costs; here we compare acceptance and failure thresholds, not overall operational costs.
The central bank's commissioned survey brings human differences into the role of cash: the proportion of respondents aged 40 and above and those in remote areas using only cash is higher. The data supports directional differences and cannot be extended into a single portrait of all elderly or rural residents.18 This round of research also lacks sufficient data to fill proportions or invent voices for minors, persons with disabilities, migrant workers, and short-term travelers. Popular tools are convenient for some, but it does not mean everyone can obtain the same account, card, phone, or network.
Heavy users in familiar chain stores and life circles may indeed not touch banknotes for a long time. Another person retaining cash might just be due to habit, privacy preference, or controlling expenses, rather than having ever failed a payment. Institutional friction, merchant acceptance, rewards, memberships, habits, preferences, and failure resilience act together; existing surveys cannot rank them in a single causal order.
The adoption threshold asks how many people can use it. The universality threshold asks if different people and stores can complete transactions across scenarios. Not carrying cash must ask again: can it be restored after failure? As the first two thresholds move forward, the number of people carrying cash may decrease, but when the last banknote leaves the wallet depends on whether exceptions have become few enough to no longer warrant backup.
The following is a hypothetical scenario constructed based on the offline limitations in the official FAQ, not an actual case: The merchant's phone is offline; the login page can still display a QR code without an amount. The customer scans the code, but the merchant does not receive the deposit push notification. Both look at their respective screens; the transaction is stuck between "can pay" and "can confirm on the spot." The customer finally puts away the phone and takes out a banknote. That banknote does not judge technology as a winner or loser; it simply, in this scenario, still does not need to ask first: "Which one do you accept here?"
Extended Reading
- Taiwan E-commerce and Digital Payment Ecosystem — Looking back at the platform and logistics wars of Taiwan's e-commerce over twenty years.
- Taiwan FinTech Development — Placing payment cases back into the ten-year development of Taiwan's FinTech between openness and risk control.
- PX Mart — Seeing how PX Mart has moved from store networks and membership management to high-frequency life platforms.
Image Sources
- Cover Image: Financial Information and Service Center (TWQR Official Website), Original Source, Fair use editorial commentary. The original image is the thumbnail for the official video "The Store Owner's Inner Thoughts | Riyue Xiang Meat Floss"; this article uses it only for commentary on TWQR institutional propaganda.
- In-Article Image: Financial Information and Service Center (TWQR Official Website), Original Source, Fair use editorial commentary. The original image is the official institutional explanation illustration for "One Contract, Multiple Payments."
References
- MIC: 2025 Mobile Payment Consumer Survey — Hu Zi-li explains that active users install more tools for different channels and publishes survey methods, adoption rates, and number ranges.↩
- MIC: 2025 Mobile Payment Consumer Survey — Data collected in Q3 2024, using online surveys, valid sample 5,000. 92% have used and 84% frequently use are limited to that sample.↩
- Central Bank: CBDC Topic Commissioned Questionnaire Survey Results — Survey methods, samples, and weighting explanations, as well as results showing 73.8% mixing, 25% only cash, 1.2% only non-cash.↩
- FSC Financial Wisdom Network: Mobile Payment Teaching Materials — Separates mobile credit cards, mobile debit cards, QR scanning, electronic payment institutions, and electronic tickets based on binding tools, technology, and regulations.↩
- MIC: 2025 Mobile Payment Consumer Survey — Publicly releases distributions for five or fewer, three or fewer, and six or more models in 2024; does not publish mean or median.↩
- FSC Banking and Supervision Bureau: Important Information on Electronic Payment Accounts for June 115 (2026) — Summed as 41,128,870; footnote defines as the number of users registered and opened by each institution whose contracts have not yet been terminated.↩
- Taiwan Mobile Payment: Merchant Operation FAQ — Explains that merchants must sign contracts with acquiring financial institutions and obtain acquiring bank, merchant, and terminal codes.↩
- Taiwan Mobile Payment: Merchant Receiving FAQ — Explains that when devices are offline, QR codes without amounts can still be generated, but login or transaction push notifications cannot be received.↩
- Taiwan Mobile Payment: Merchant Receiving FAQ — Officially states that transaction processing fees are determined by contracts between merchants and acquiring banks; cannot be inferred as a unified market fee rate.↩
- National Cheng Kung University: Research on Adoption of Mobile Payments by Tainan Commercial District Stores — PhD dissertation abstract lists significant and insignificant factors for adoption intention; research scope limited to Tainan commercial district samples.↩
- Central Bank: CBDC Topic Commissioned Questionnaire Survey Results — Vendor 611 samples, Store 1,436 samples, linking the difference in "only accepting cash" to venue, equipment, and scale.↩
- Central Bank: Payment Tool Survey in Financial Stability Report — Charts list multiple-choice difficulties such as store non-acceptance, non-acceptance of usual tools, too many types, signal, and phone battery.↩
- MIC: 2025 Mobile Payment Consumer Survey — Survey lists financial services other than payment consumption, where bill splitting and point gifting are the most common types.↩
- Visa Taiwan: 2022 Mobile Wallet and Electronic Payment Consumer Research — Reveals Taiwan 1,000 samples aged 18-55 and proportions tracking rewards and calculating discounts.↩
- Ministry of Economic Affairs Statistics Bureau: Press Release PDF on Retail Mobile Payment Payment Ratio — 2017, 2023 payment amount proportions from the Business Operations Survey of Wholesale, Retail, and Catering Industries and membership ecosystem explanations.↩
- Central Bank: 2025 Annual Report — Lists TWQR participating institutions, contracted partner stores at the end of 2025, and total annual transaction counts and amounts.↩
- Bank of Taiwan: TWQR Cross-Institution Acquiring Service — Separates usable institutions for Main Scan and Be Scanned, QR Auth specifications, and merchant application methods, showing interoperability is layered by direction and specification.↩
- Central Bank: CBDC Topic Commissioned Questionnaire Survey Results — Report presents directional differences by age and region; this article does not fabricate specific group proportions or voices based on this.↩