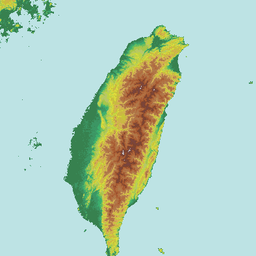
In 2024, the physician workforce ratio between the two groups of townships/cities with the highest and lowest levels of urbanization was 8.94. If looking only at hospital departments, this ratio rises to 82.95. 1
Converting this to physicians per 10,000 people provides a more intuitive view: the highest group has 46.40 people, while the lowest group has 5.19; for hospital departments, it is 21.93 versus 0.26. 1
The Distance Between Two Groups
The National Health Insurance Administration (NHIA) includes this indicator under the "Resource Allocation" dimension, focusing on the equity of manpower supply. The calculation categorizes townships and cities into five levels based on their degree of development; the ratio is then derived by dividing the highest group by the lowest group. 1
A higher ratio indicates a greater concentration of physicians in urban areas. In 2024, the total ratio was 8.94; in 2012 (111), it was 9.08, and in 2023 (112), it was 8.92, showing relative stability over three years. 1
| 2022 | 95.81 | Highest group: 21.90 per 10k / Lowest group: 0.23 per 10k |
|---|---|---|
| 2023 | 93.77 | 21.801 |
| 2024 | 82.95 | 21.931 |
Source: NHIA "2024 National Health Insurance Monitoring Indicator Results Report," Indicator 4.1
Although the ratio for hospital departments remains high, it is the only department that has shown a continuous decline over the three years: 95.81, 93.77, and 82.95. 1 The number of hospital physicians per 10,000 people in the lowest group increased from 0.23 to 0.26, while the highest group remained around 21.9.
Disparities Vary by Department
When applying the same algorithm to different departments, the magnitude of the gap varies significantly. 1
Primary Western medicine has a ratio of 2.54 (2.47 in 2022, 2.46 in 2023), the smallest among the four departments; Traditional Chinese Medicine (TCM) is 9.17 (9.45 in 2022, 8.93 in 2023); dentistry is 14.60 (14.43 in 2022, 14.57 in 2023); and hospitals are at 82.95. 1
These figures demonstrate that the "physician shortage in rural areas" is not a monolithic phenomenon. One possible explanation is that primary care clinics have lower barriers to entry and smaller service ranges, leading to a relatively even distribution; conversely, hospitals require equipment, teams, and capacity for acute/critical care, which amplifies the urban-rural divide.
There was another change in 2024: the ratios for primary Western medicine, dentistry, and TCM all rose slightly compared to 2023 because the number of physicians in the highest group increased, while the lowest group decreased slightly or remained stable. 1
Utilization Rates: Hospitals and Primary Care are Highest in Outlying Islands
Physician distribution and medical utilization rates are not the same thing. The NHIA uses different utilization rates for "General Areas," "Medical Resource-Deficient Areas," and "Mountainous and Outlying Island Areas" to observe accessibility. 1
In 2024, the hospital department utilization rates were: 55.71% in General Areas, 58.65% in Medical Resource-Deficient Areas, and 62.41% in Mountainous and Outlying Island Areas. For primary Western medicine, the rates were 82.78%, 82.80%, and 87.02%, respectively. 1
Both departments saw their highest utilization in mountainous and outlying island areas. The report does not explain why hospital and primary care utilization is higher in these regions. It is important to note that this indicator only counts "the number of people who received medical care"; it does not reflect the specialty treated, whether the care was continuous, or whether local medical resources are actually abundant.
Gaps in Dentistry and TCM
The true gaps lie in dentistry and TCM. 1
In 2024, dental outpatient utilization rates were: 48.80% in General Areas, 39.22% in Medical Resource-Deficient Areas, and 42.65% in Mountainous and Outlying Island Areas. For TCM outpatient care: 28.56%, 24.78%, and 24.42%. 1
Source: NHIA "2024 National Health Insurance Monitoring Indicator Results Report," Indicator 4.2
The dental utilization rate in medical resource-deficient areas is less than 40%. The report states that "more than half of the population does not receive regular dental checkups." This figure only counts NHI-covered dental outpatient visits and excludes self-pay consultations. The report directly links this to oral health (cavities, periodontal disease). 1
The gap is narrowing. The difference in dental outpatient utilization between resource-deficient areas and general areas narrowed from -15.43 percentage points in 2023 to -9.58 in 2024; for TCM, it narrowed from -7.36 to -3.78. 1
How the System Incentivizes Physicians to Move
Over the years, the NHI has allocated two types of funding across various departments: the Medical Resource-Deficient Area Improvement Program and the Integrated Delivery System (IDS) for Mountainous and Outlying Island Areas. 1
The approach is to encourage physicians to open clinics or perform mobile medical services in resource-deficient areas—bringing the service to them, rather than waiting for patients to come to the city. 1
Several adjustments are set for 2025: an increase in the monthly guaranteed amount for the Medical Resource-Deficient Area Improvement Program for the dental department; adjustments to the implementation areas for TCM; and the IDS is planned to transform into the "Rural Area Holistic Integrated Care Implementation Program," where participating institutions form teams to provide health promotion, preventive care, diagnosis, follow-up, and health management. 1
Ratios and Utilization Rates Must Be Viewed Together
If these two sets of numbers are read separately, it is easy to reach opposite conclusions.
Looking only at the physician workforce ratio makes rural healthcare seem like it is collapsing; looking only at utilization rates makes medical care in outlying islands seem more convenient than in cities. Both are correct, but neither is complete. 1
A more complete reading is: while hospital and primary care utilization rates in mountainous and outlying island areas are not low, this indicator does not show the specialty or continuity of care. Dentistry and TCM, however, have low utilization rates themselves, representing an accessibility gap.
The next time the NHIA releases these indicators, three things are worth watching: whether the hospital department ratio continues to trend down from 82.95; whether the urban-rural gap in dentistry and TCM continues to narrow; and whether, after the IDS transformation, the utilization rate in mountainous and outlying island areas shifts from being merely "high" to being "high and reasonable."
Further Reading:
- Emergency Room Congestion — The final stop for rural referrals is often the ER of large hospitals.
- Development of Taiwan's Long-Term Care System — The next stage of care for people with disabilities in rural areas is similarly affected by manpower distribution.
- Taiwan's Healthcare and National Health Insurance — The upstream aspects of global budgets and resource allocation.
References
- 2024 National Health Insurance Monitoring Indicator Results Report (National Health Insurance Administration, Ministry of Health and Welfare, November 2025) — Indicator 4.1 specifies the physician workforce ratios between the highest and lowest urbanization groups from 2022–2024 (Total: 9.08, 8.92, 8.94; Hospital: 95.81, 93.77, 82.95; Primary Western Medicine: 2.47, 2.46, 2.54; Dentistry: 14.43, 14.57, 14.60; TCM: 9.45, 8.93, 9.17) and physicians per 10,000 people; Indicator 4.2 specifies utilization rates for General Areas, Medical Resource-Deficient Areas, and Mountainous/Outlying Island Areas (Hospital: 55.71%, 58.65%, 62.41%; Primary Western Medicine: 82.78%, 82.80%, 87.02%; Dentistry: 48.80%, 39.22%, 42.65%; TCM: 28.56%, 24.78%, 24.42%) and changes in the urban-rural gap; the report also explains IDS, the Medical Resource-Deficient Area Improvement Program, and adjustments for 2025.↩23456789101112131415161718