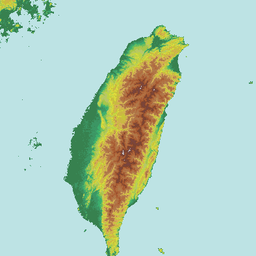
In 2025, there were 18,944,436 outbound trips by Taiwanese citizens. In the same year, there were 8,574,547 inbound visitors to Taiwan. 1
Outbound trips were 2.21 times the number of inbound visitors. This ratio is the most direct metric for understanding Taiwan's tourism: travelers are not absent; rather, those going abroad outnumber those coming in by more than double.
The 2.21x Gap Between Inbound and Outbound Trips
First, looking at the inbound side. In 2025, there were 8,574,547 inbound visitors, an increase of 9.12% compared to 2024. 1
Now, looking at the outbound side. There were 18,944,436 outbound trips by citizens, of which Asia accounted for 93.51%, the Americas 3.46%, Europe 1.90%, and Oceania 1.10%. 1
Source: Tourism Administration "2025 Taiwan Tourism Business Annual Report" - Taiwan Tourism Market
Sources of inbound visitors are highly concentrated. Japan ranks first with 1,483,176 trips (17.30%), followed by Hong Kong and Macau with 1,310,139 trips (15.28%), and South Korea with 1,016,520 trips (11.86%). These three regions combined account for approximately 44%. 1
By purpose, "sightseeing" accounted for 5,883,794 trips (68.62%), while "other" purposes accounted for 1,714,351 trips (19.99%). Among inbound visitors, women made up 51.95%, and the largest age group was 30 to 39, accounting for 23.37%. 1
How Much Each Person Spends
Beyond trip counts, the second set of metrics involves length of stay and spending.
In 2025, the average stay for inbound visitors was 6.95 nights, a decrease of 0.03 nights compared to 2024; average daily spending was US$185.14, an increase of US$2.31. 1
Combining these two factors, the annual report estimates that total tourism expenditure in Taiwan was NT$343.9 billion, an increase of 6.80% over 2024; in US dollars, this was US$11.033 billion, an increase of 10.02%. 12
The annual report describes this shift as "travelers moving toward deep experiences and refined services with shorter stays but more concentrated spending." 1 In other words, the number of people has returned, but individual time spent is shorter while per-unit spending is higher.
Domestic Travel: 248 Million Trips
The third set of figures concerns domestic travel. In 2025, citizens aged 12 and above made 248 million domestic trips, with total spending reaching US$18.106 billion—an increase of 12.70% over 2024. Both figures hit record highs. 1
On average, individuals traveled 11.65 times per year, an increase of 1.19 times compared to 2024; however, the average trip lasted 1.32 days, a decrease of 0.07 days. The weekend travel rate increased by 0.5 percentage points, and overall travel satisfaction was 98.7%. 1
The annual report characterizes this as "short-duration, high-frequency light travel." 1 More frequent trips with shorter durations define the current shape of domestic tourism.
Where Taiwanese People Go Abroad
Asia accounted for a total of 17,715,833 trips (93.51%), with Japan being the top destination at 6,730,817 trips, followed by mainland China (3,237,511), South Korea (1,835,061), Hong Kong (1,626,176), and Vietnam (1,214,362). 1
Japan is simultaneously the largest source of inbound visitors and the largest outbound destination for Taiwanese citizens—with approximately 1.48 million inbound vs. 6.73 million outbound trips, a 4.5-fold difference. This bidirectional but highly asymmetrical flow is one of the most striking relationships in Taiwan's tourism structure.
US$29.139 Billion and 3.16% of GDP
Combining inbound tourism and domestic travel, total tourism revenue in 2025 was approximately US$29.139 billion, accounting for 3.16% of the year's GDP. 2
Of this, inbound visitor expenditure was US$11.033 billion, while domestic travel expenditure was US$18.106 billion. The scale of domestic tourism is approximately 1.64 times that of inbound tourism. 2
| Item | Amount | Description |
|---|---|---|
| Inbound Visitor Expenditure | US$11.033 billion | +10.02% vs 2024 |
| Domestic Travel Expenditure | US$18.106 billion | +12.70% vs 2024 |
| Total | US$29.139 billion | 3.16% of GDP |
Source: Tourism Administration "2025 Taiwan Tourism Business Annual Report" - Total Tourism Revenue
This composition illustrates one point: when discussing Taiwan's tourism, if attention is focused solely on inbound visitors, one misses the domestic travel sector which accounts for approximately 60% of total revenue.
Foot Traffic at Key Sites
The final set of figures concerns foot traffic at physical attractions. In 2025, there were 393 major tourism and recreation sites across Taiwan. After excluding sites added or removed since 2024 and comparing the 359 identical sites, 207 showed growth while 152 showed a decline. 1
The annual report highlights growth in cultural and religious sites: Confucian Temple complexes, the area around Chihkan Tower, the National Taiwan Museum of Fine Arts, Dajia Zhenlan Temple, and the Victory Star Village Creative Life Park all saw significant growth. Among museum-type sites, 29 showed growth, while religious sites were led by the prominence of Dajia Zhenlan Temple. 1
Another trend is the return to offshore islands and specialized scenic areas. The Gu Ning Tou War History Museum, the Taroko National Park Visitor Center, and several visitor centers in Penghu all showed significant growth. Conversely, some sites declined due to weather, facility renovations, or regional competition, such as Wufengqi and Fuyuan Forest Recreation Area. 1
Putting the Three Sets of Figures Together
The 2.21x ratio describes the direction of flow; US$11.033 billion vs. US$18.106 billion describes the revenue structure; and 207 vs. 152 describes the diversification of attractions.
Taken together, the current state of Taiwan's tourism is not as simple as "fewer travelers": inbound trips are growing, domestic travel is hitting new highs, and different types of attractions are seeing simultaneous winners and losers. 12
If there is one question that most needs answering, it might be this: when citizens make 18.94 million outbound trips and 248 million domestic trips—two things that do not conflict—when will the number of inbound visitors return to a scale comparable to outbound travel? The annual report provides no answer.
Further Reading:
- The Economics of Night Markets — Among the 248 million domestic trips, night markets are the most common stop.
- Taiwan's All-Age Inclusive Tourism and Living Culture — Another dimension of accessibility in tourism.
- Tainan Railway Underground Project — How urban transit engineering changes tourism routes.
References
- Taiwan Tourism Market ("Republic of China 2025 Taiwan Tourism Business Annual Report", Ministry of Transportation and Communications, Tourism Administration) — Official report page, stating 8,574,547 inbound visitors in 2025 (+9.12%), distribution of source countries and purposes, average stay of 6.95 nights and daily spending of US$185.14, total tourism expenditure of NT$343.9 billion, 18,944,436 outbound trips by citizens and destination distribution, 248 million domestic trips and US$18.106 billion in spending, and the growth/decline counts for 359 sites.↩2345678910111213141516
- Total Tourism Revenue ("Republic of China 2025 Taiwan Tourism Business Annual Report", Ministry of Transportation and Communications, Tourism Administration) — Official report page, stating total tourism revenue of US$29.139 billion (3.16% of GDP), inbound visitor expenditure of US$11.033 billion (+10.02%), and domestic travel expenditure of US$18.106 billion (+12.70%).↩234